August 30, 2023
August 2023 Marin County Market Report
By Compass
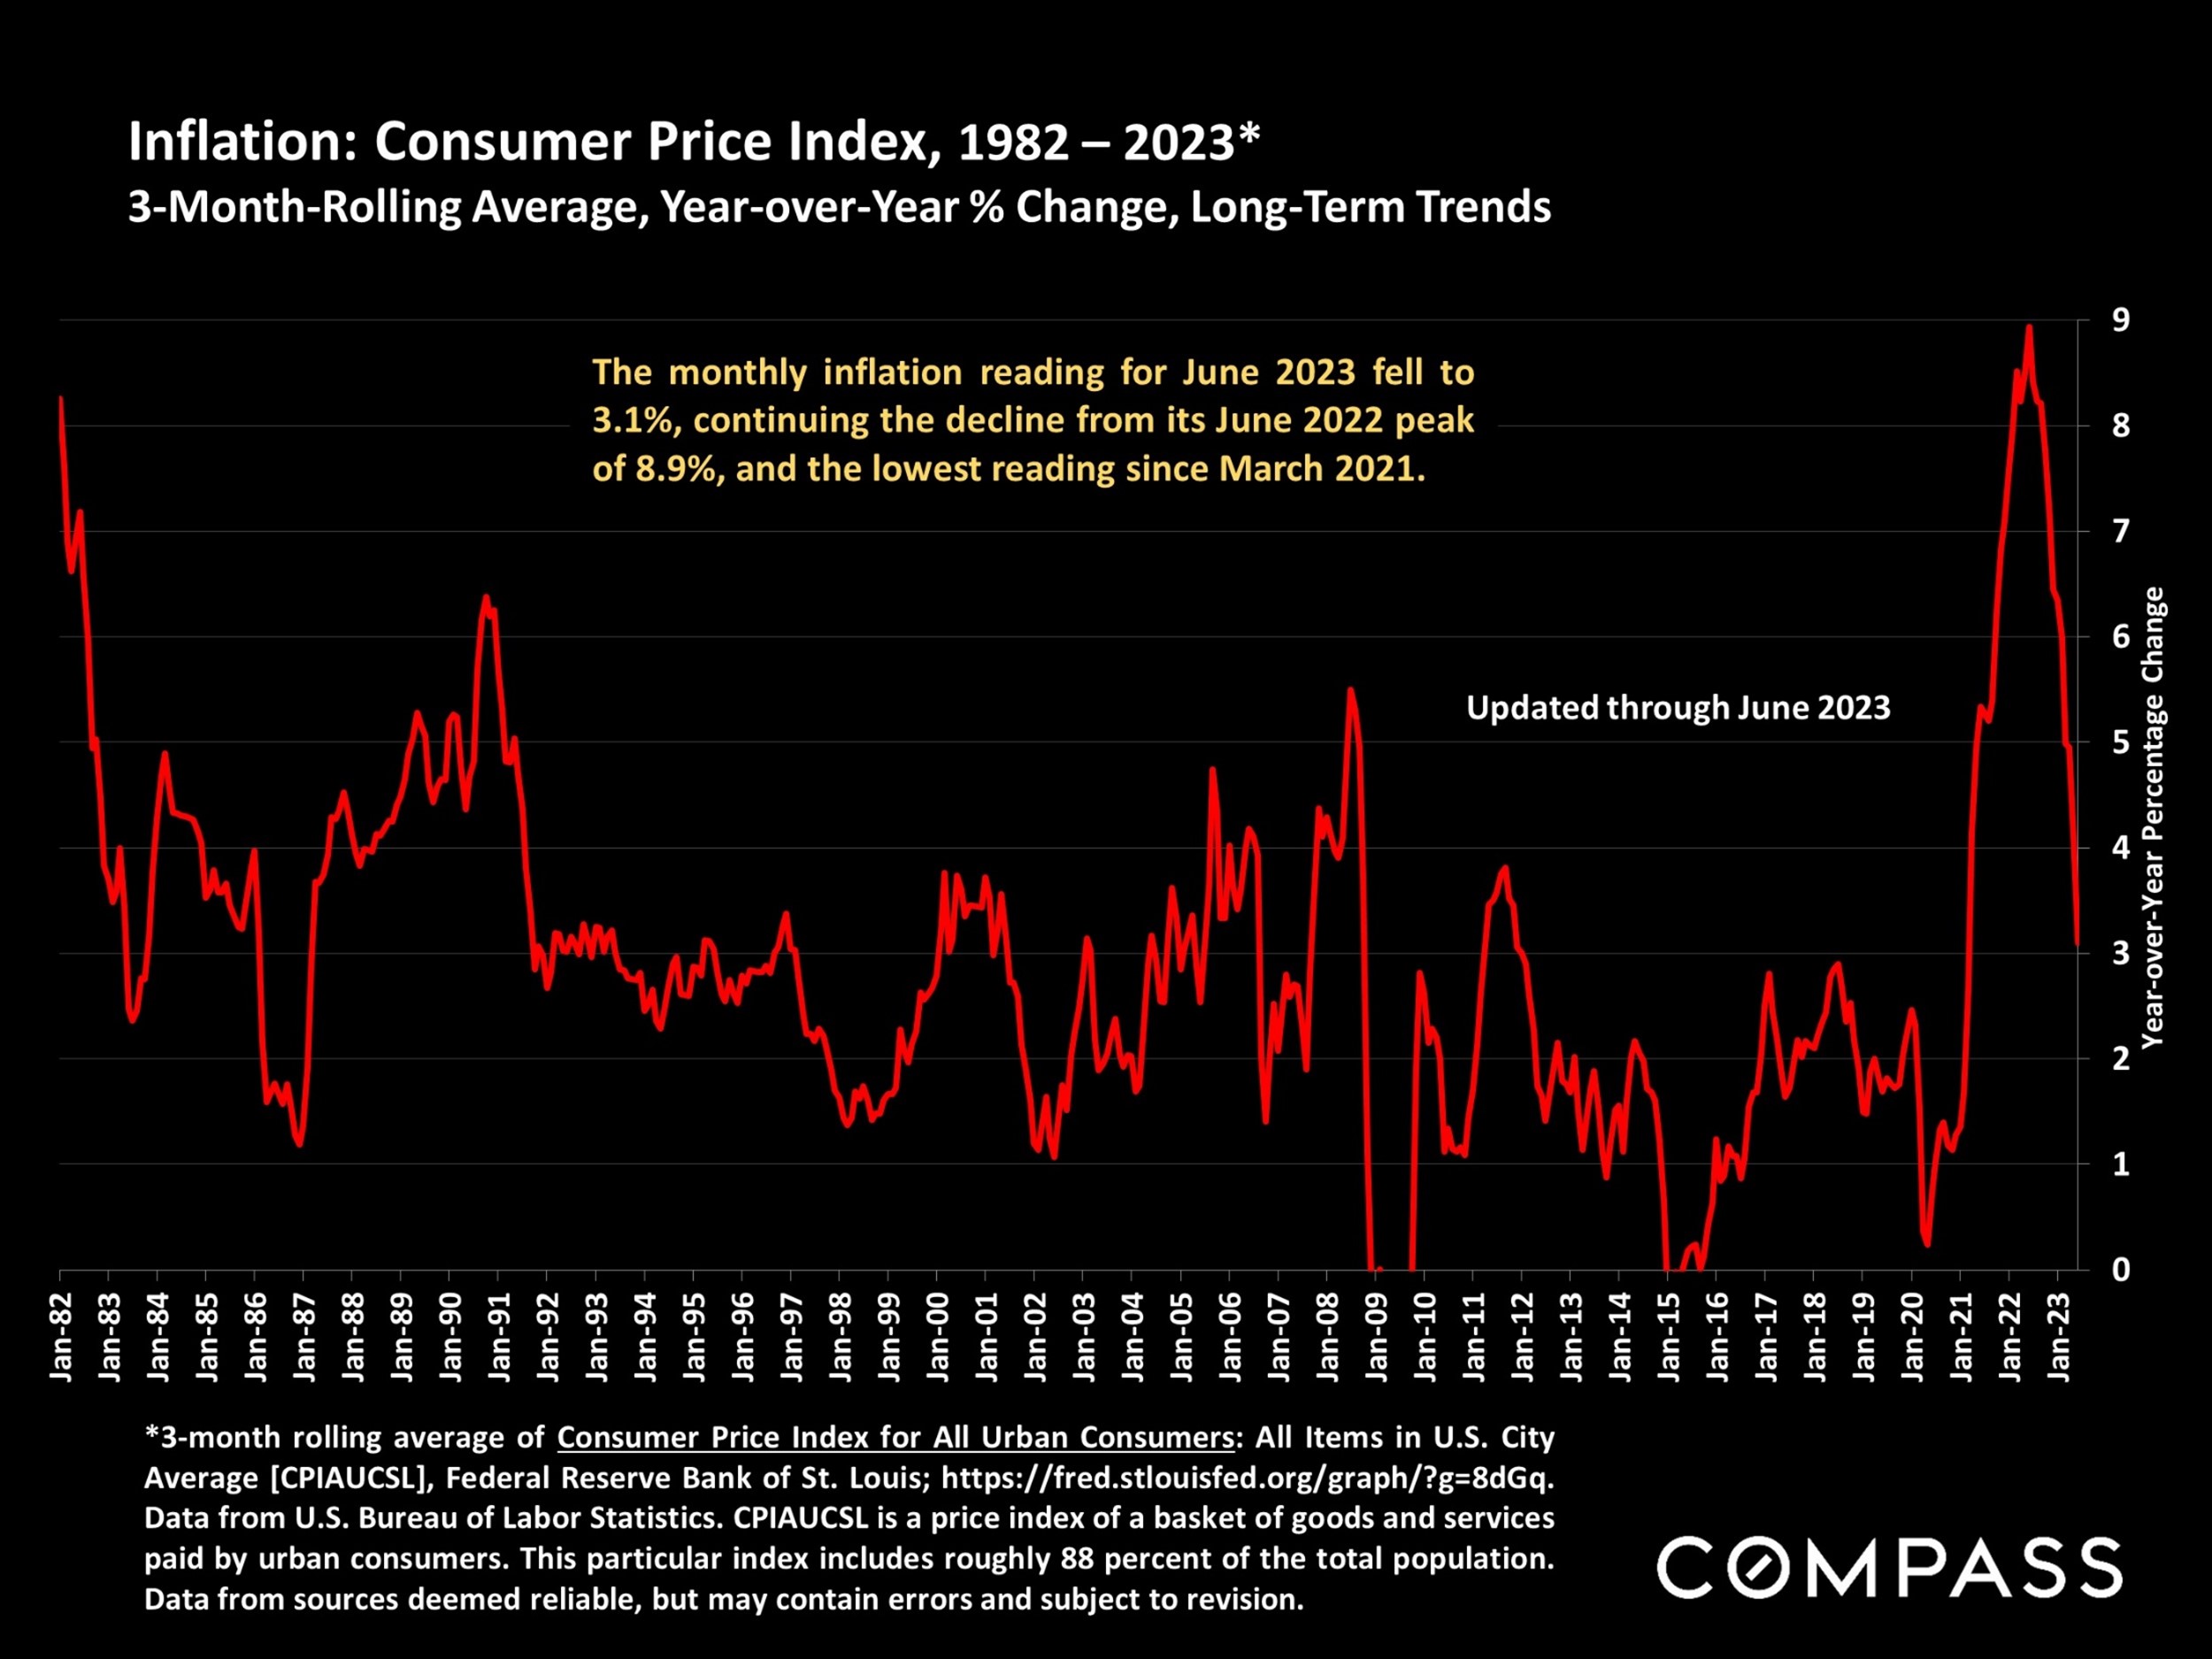
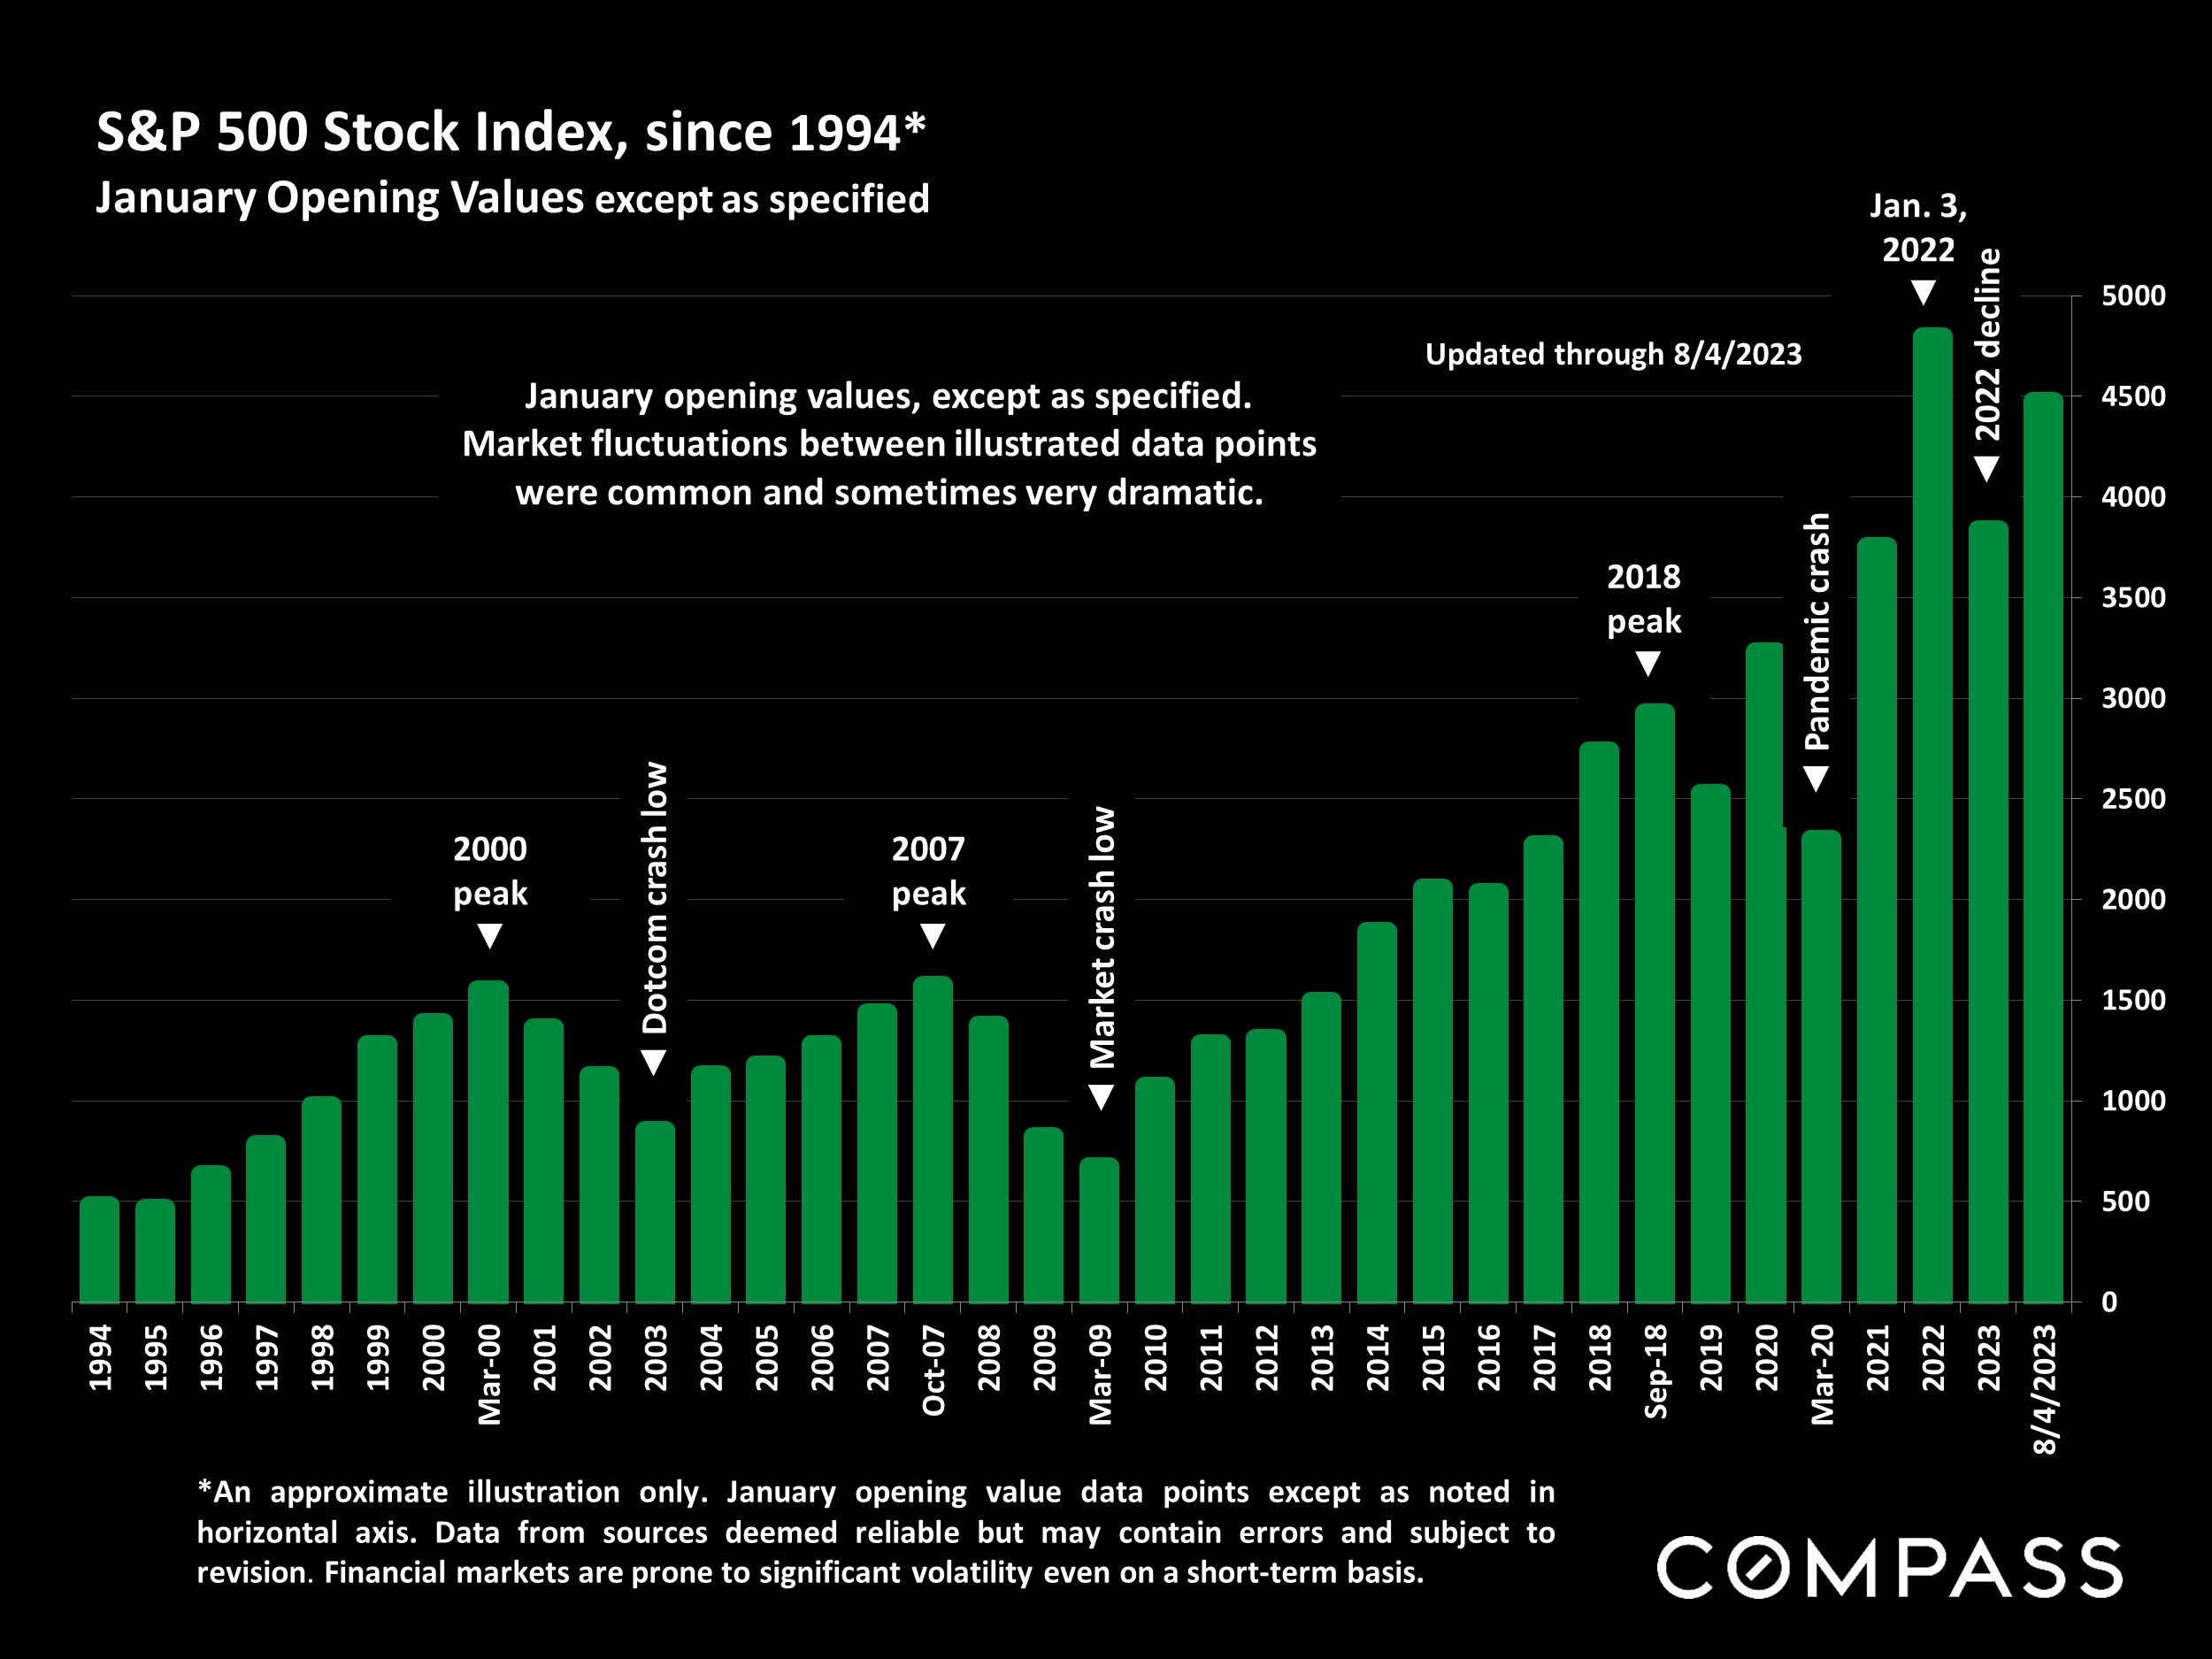
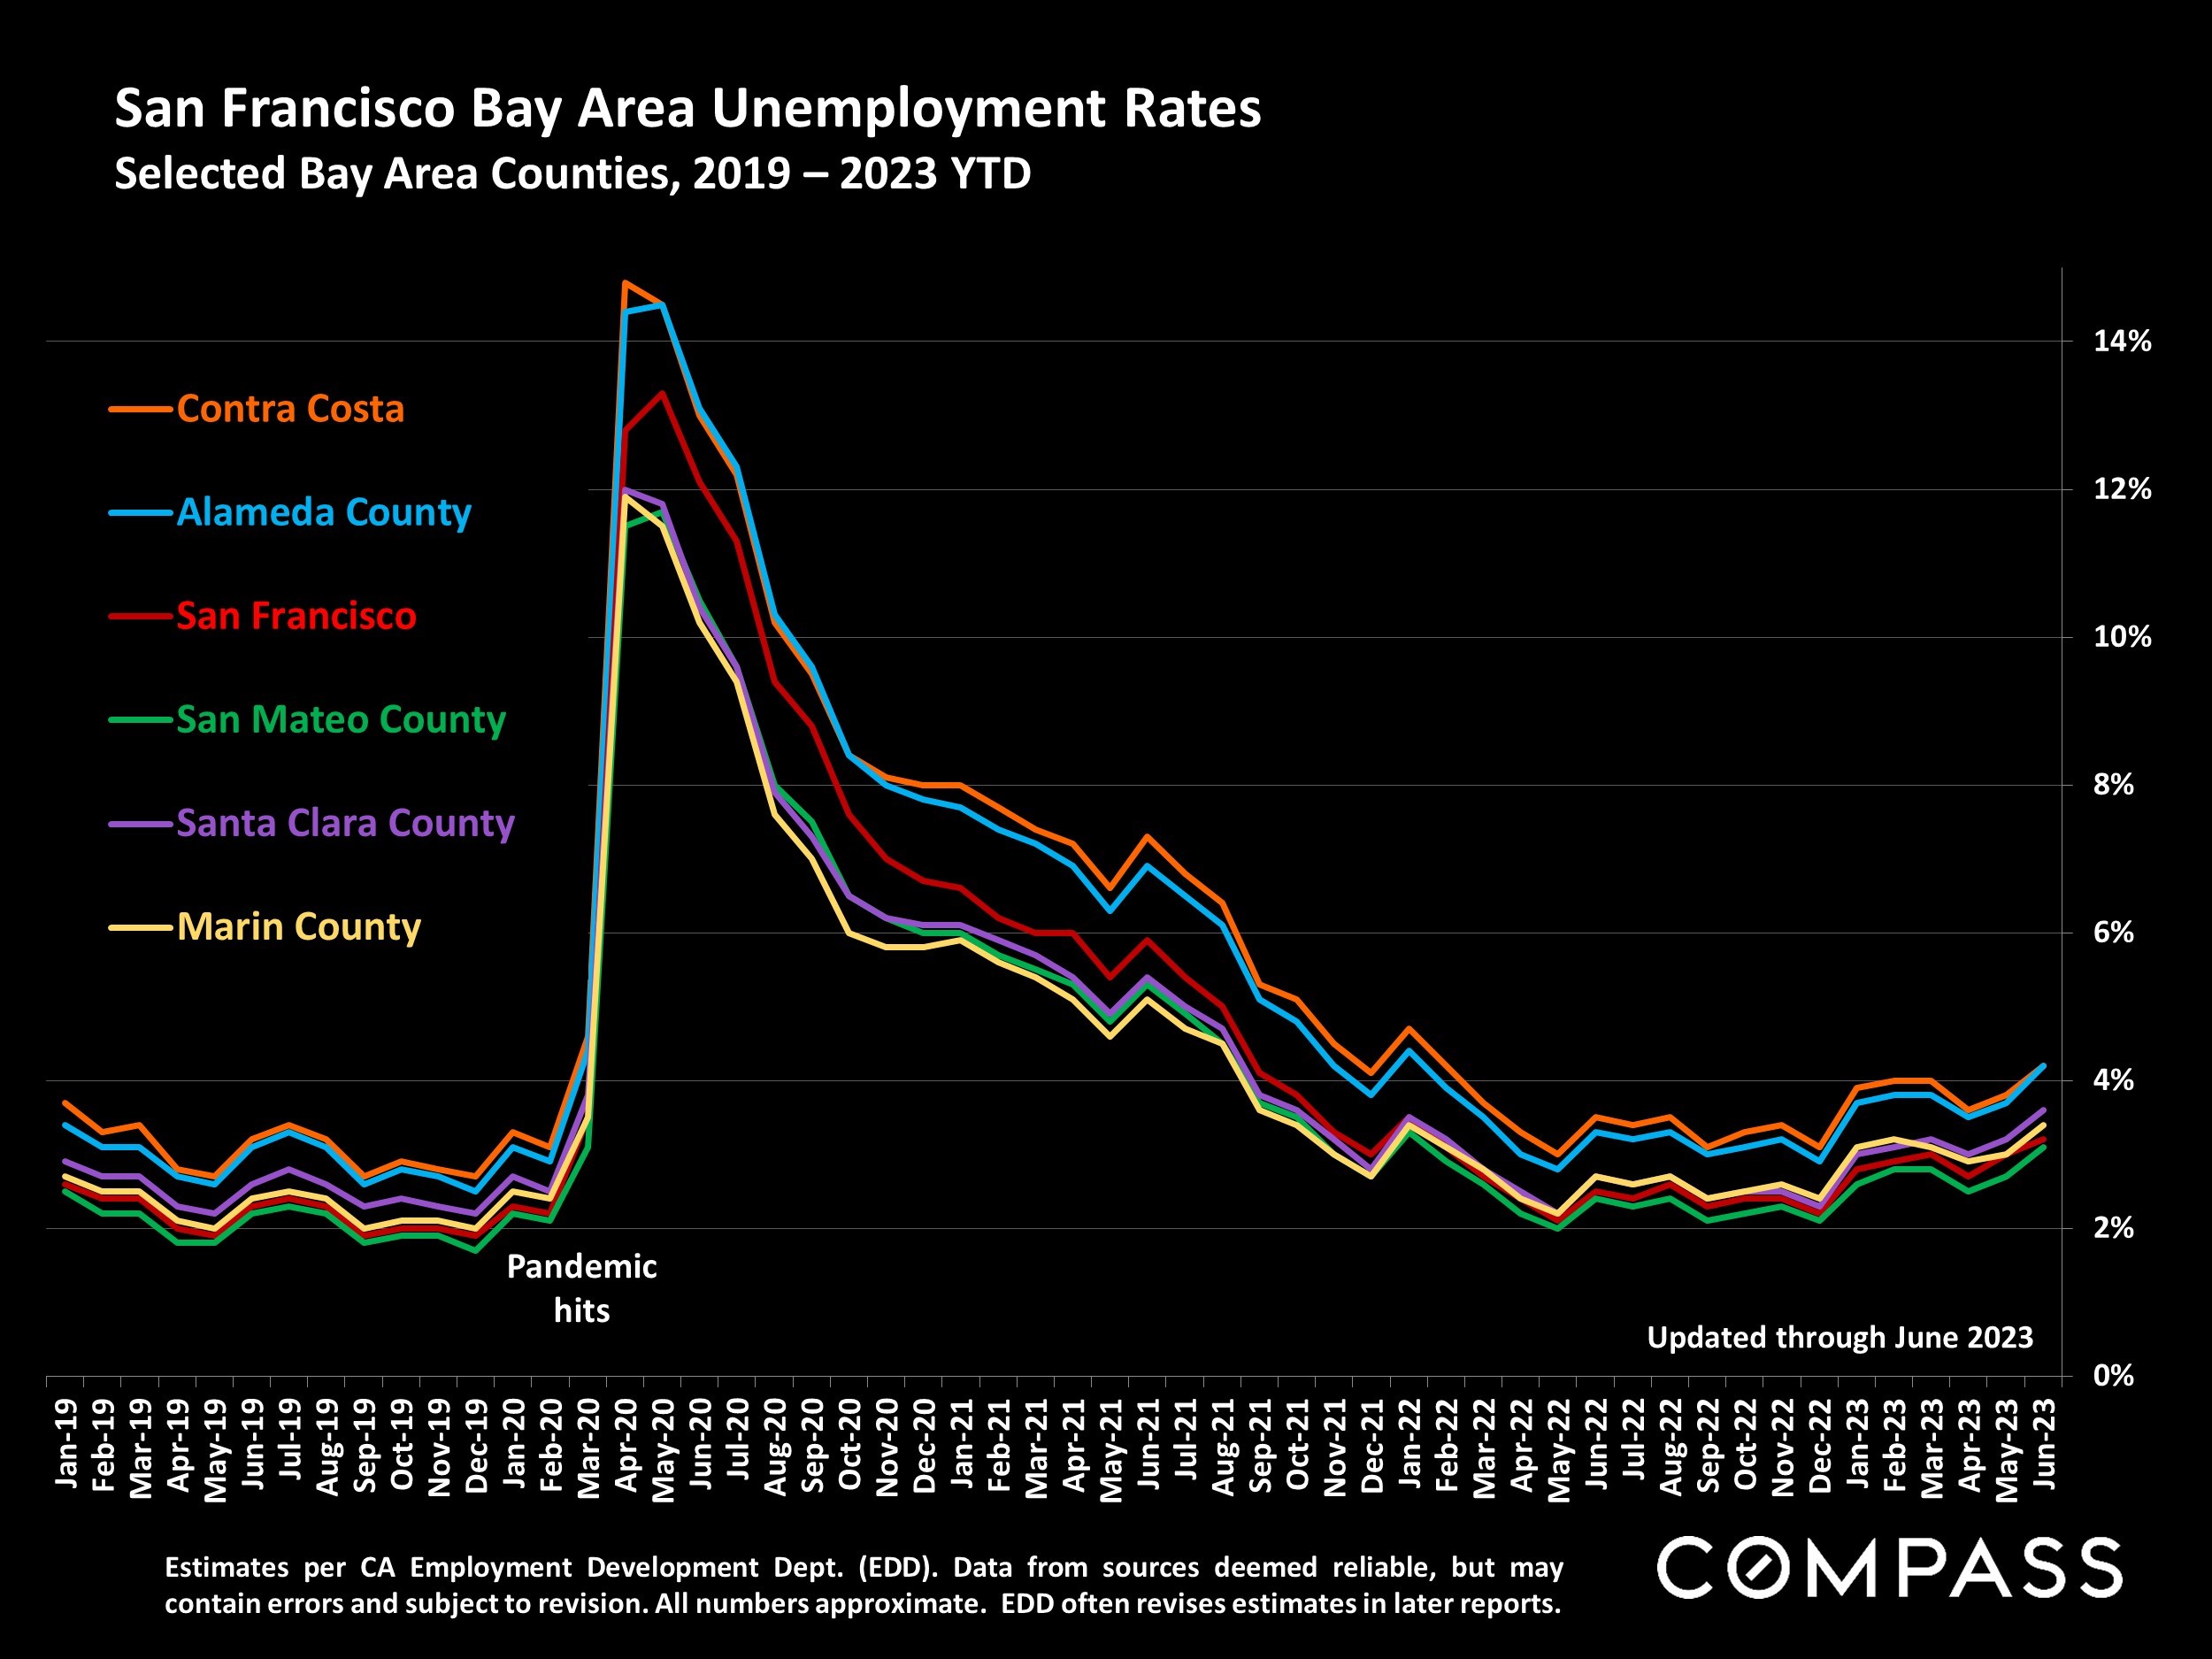
Generally speaking, the market began to slow in July, a common seasonal trend. August is usually one of the quietest months of the year – though last year, a sudden but short-term drop in interest rates kindled buyer demand in August. Underlying economic dynamics – interest rates, inflation, financial markets, employment – remain on the same general tracks as in recent months. The Consumer Confidence Index jumped in July, hitting its best reading since October 2021: The Index is now about halfway between its historic low in June 2022 and the pre-pandemic reading in February 2020.
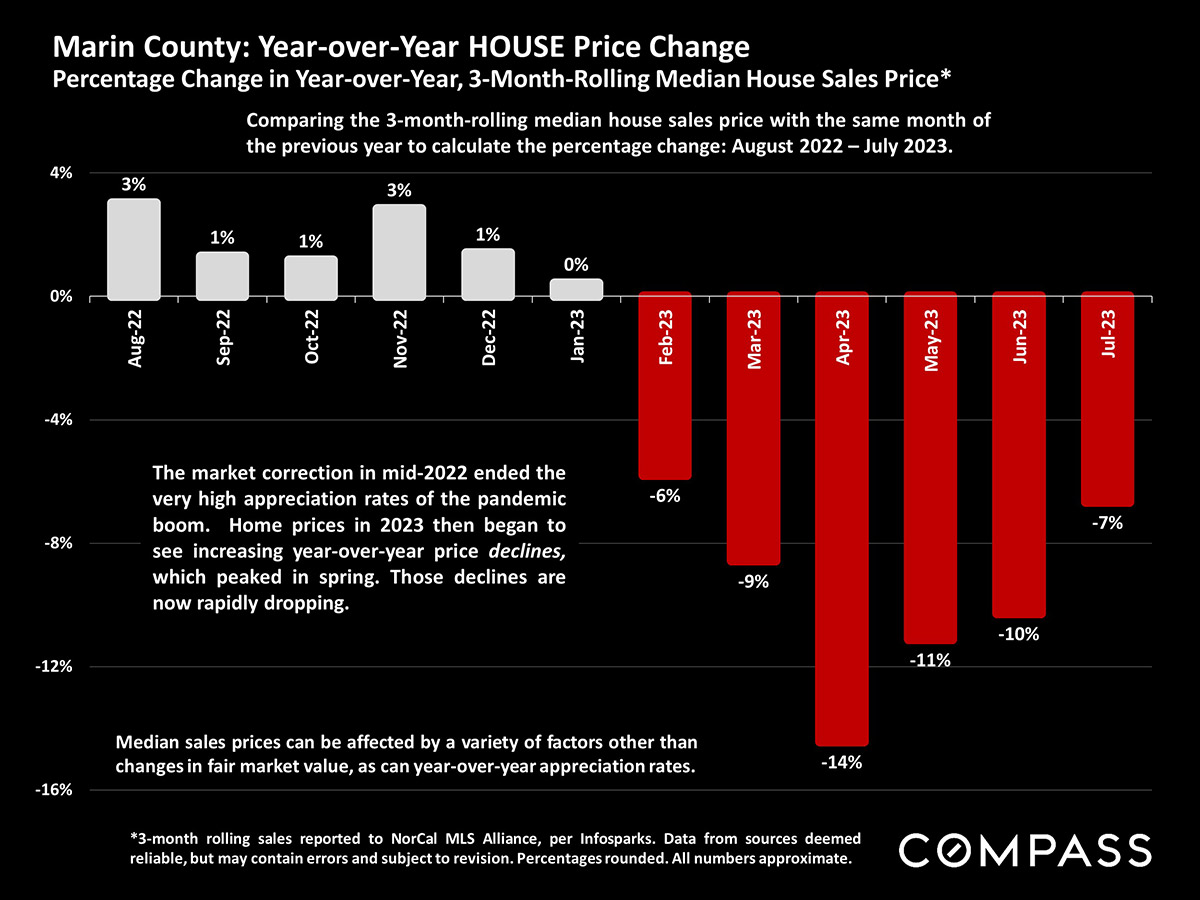
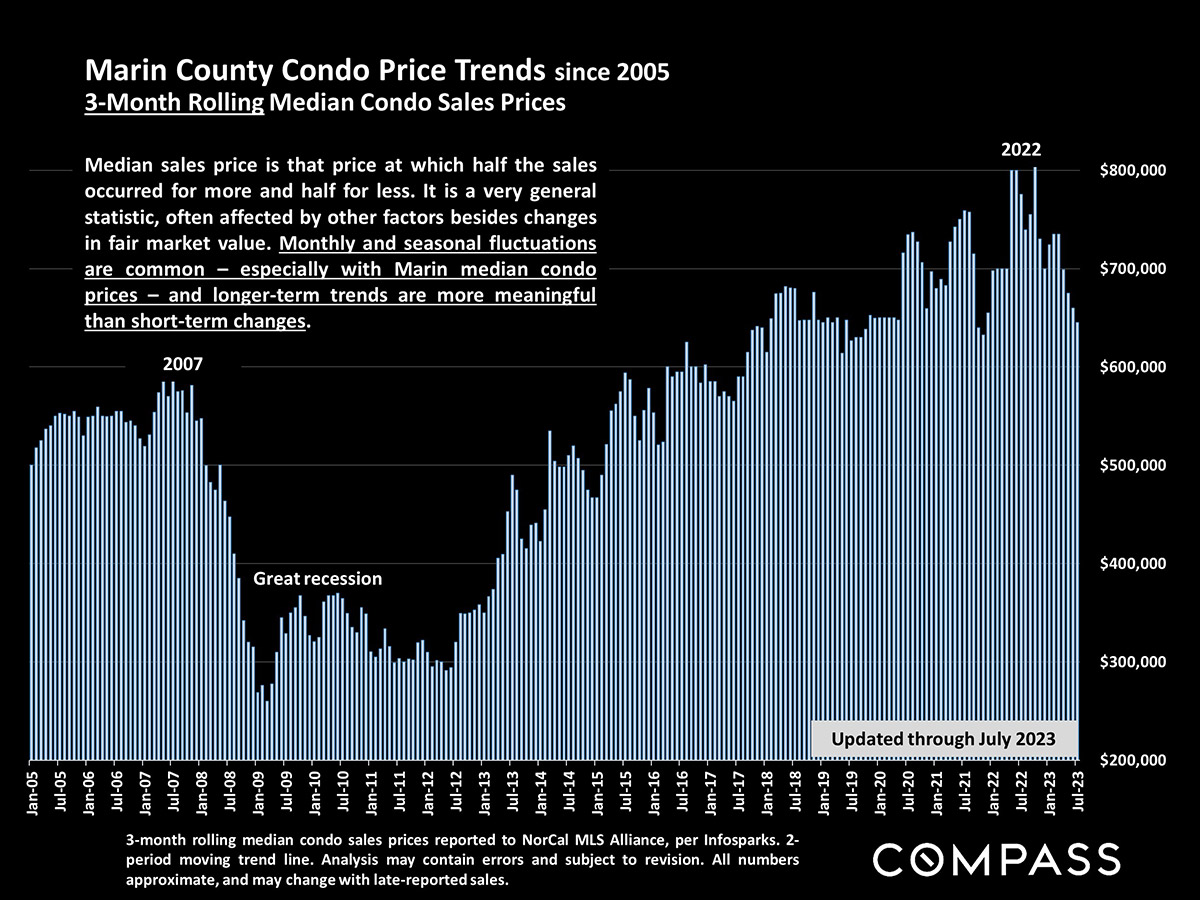
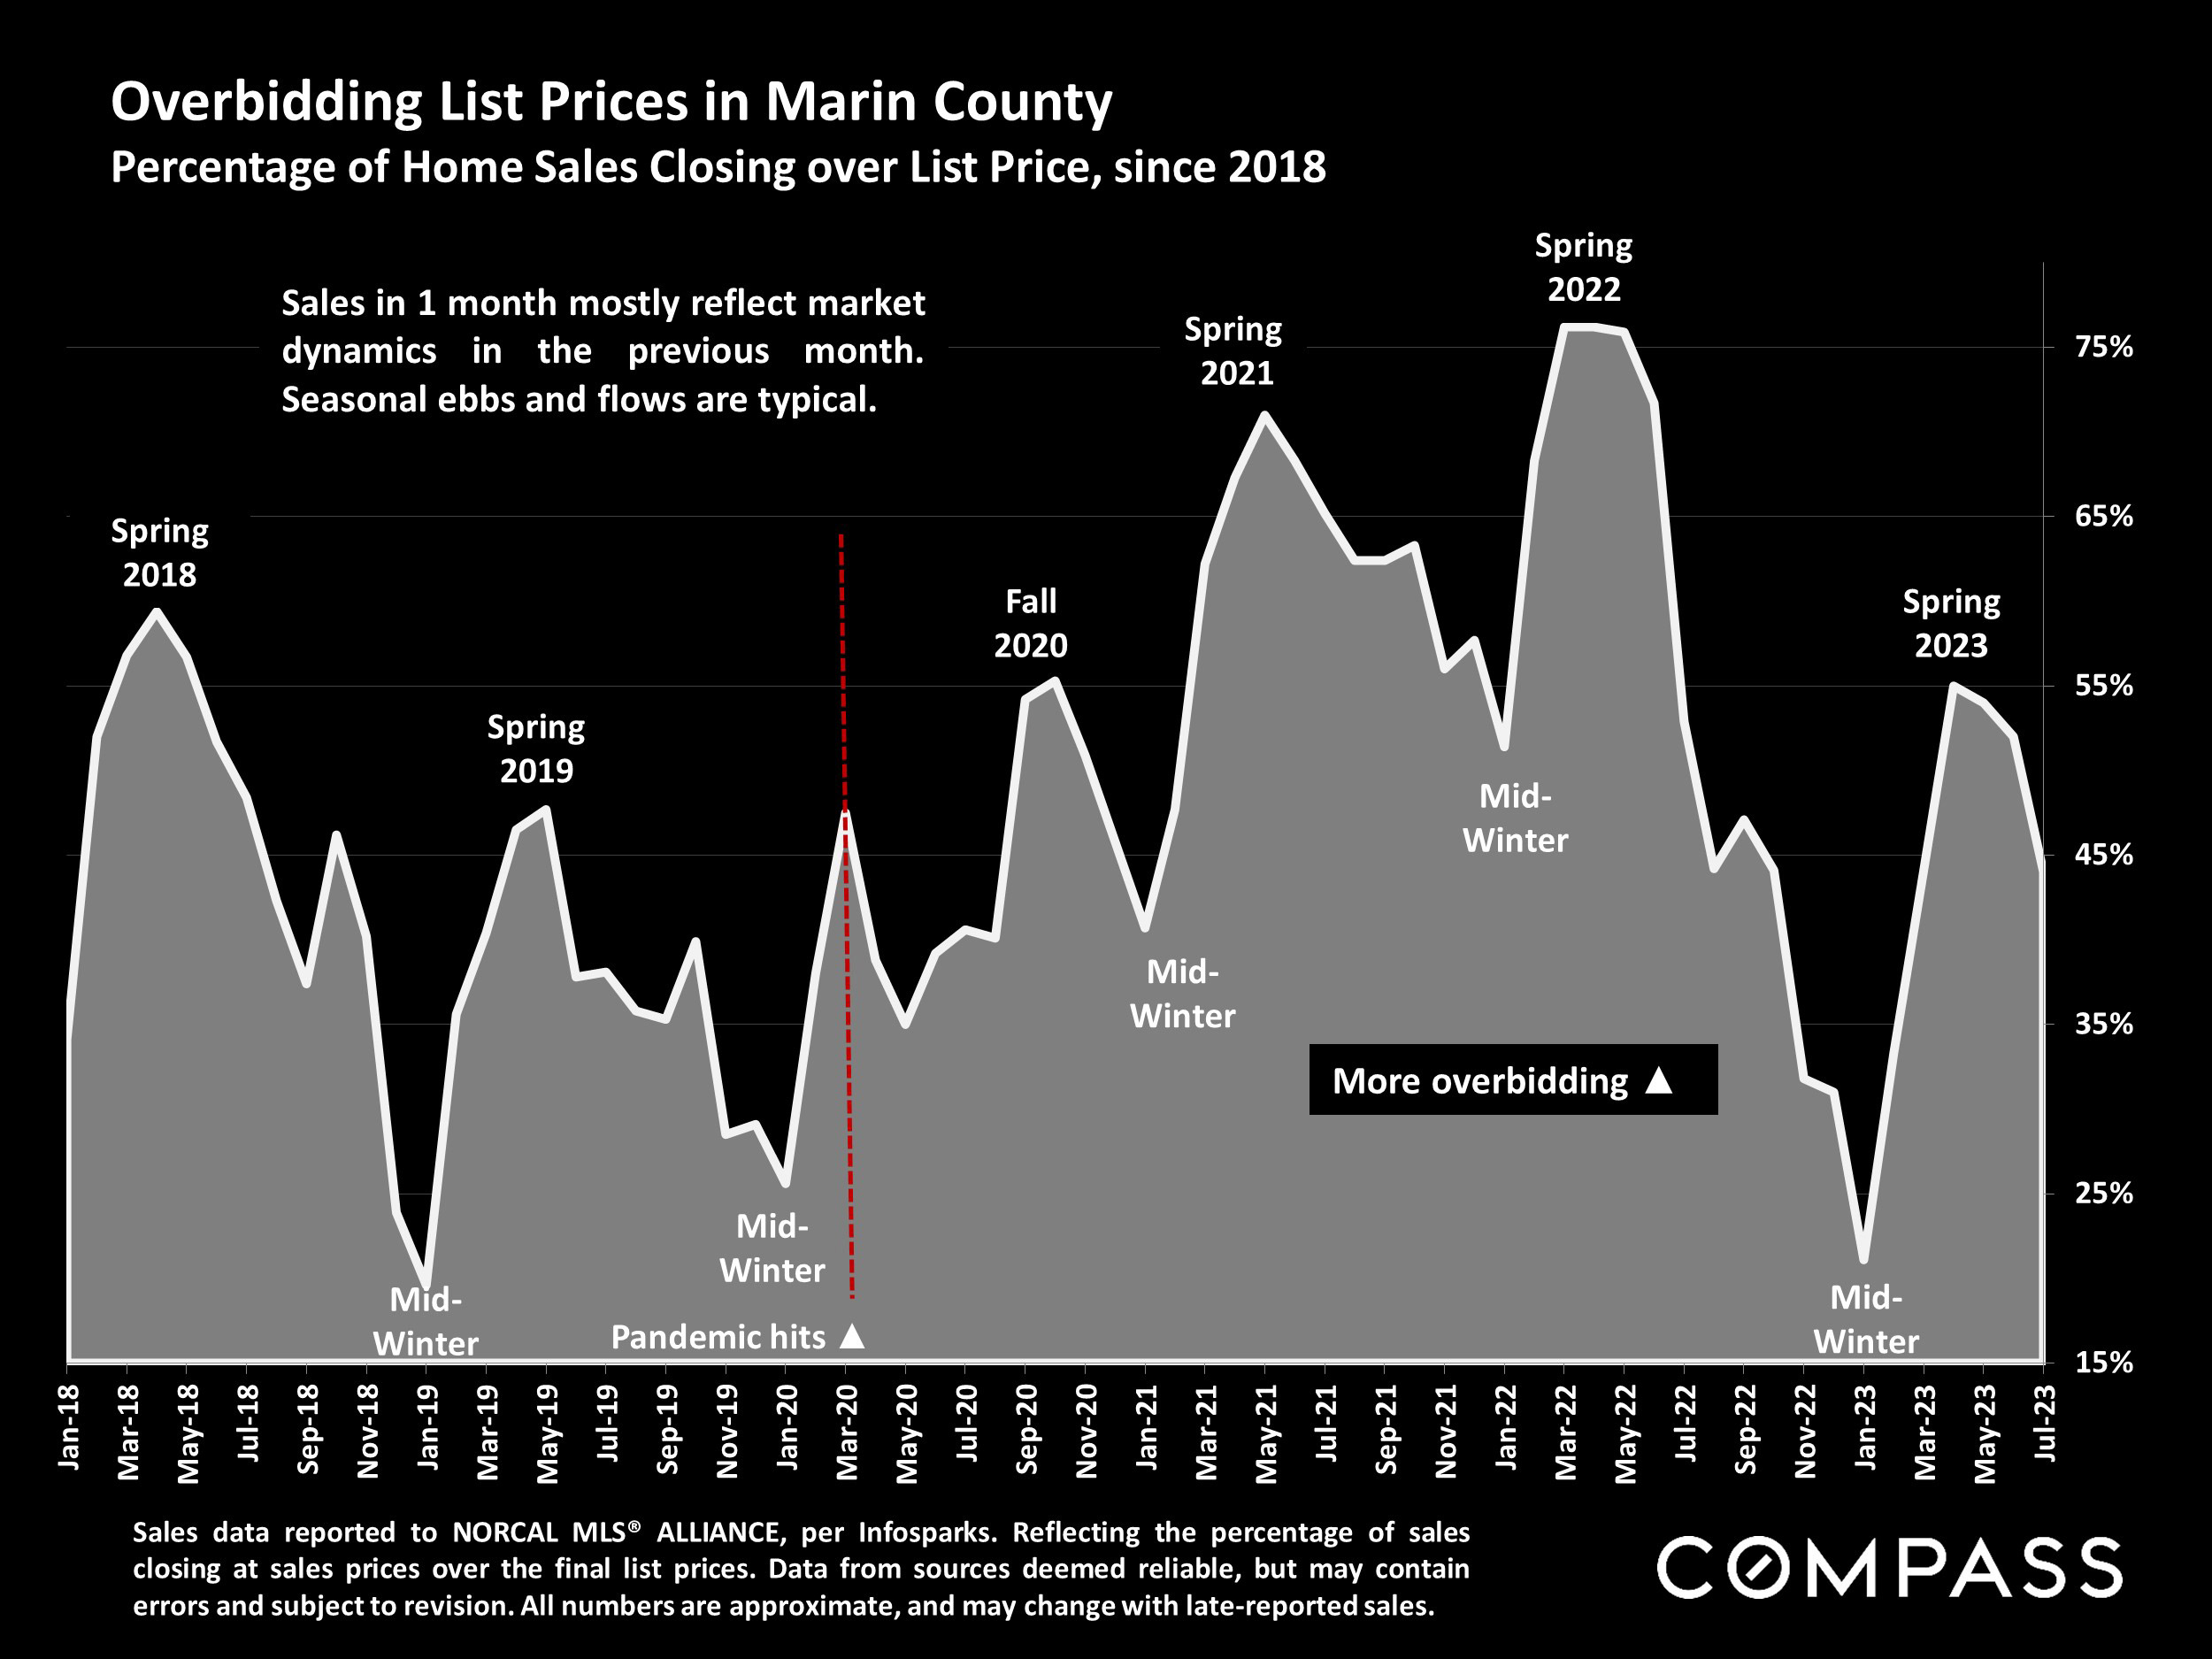
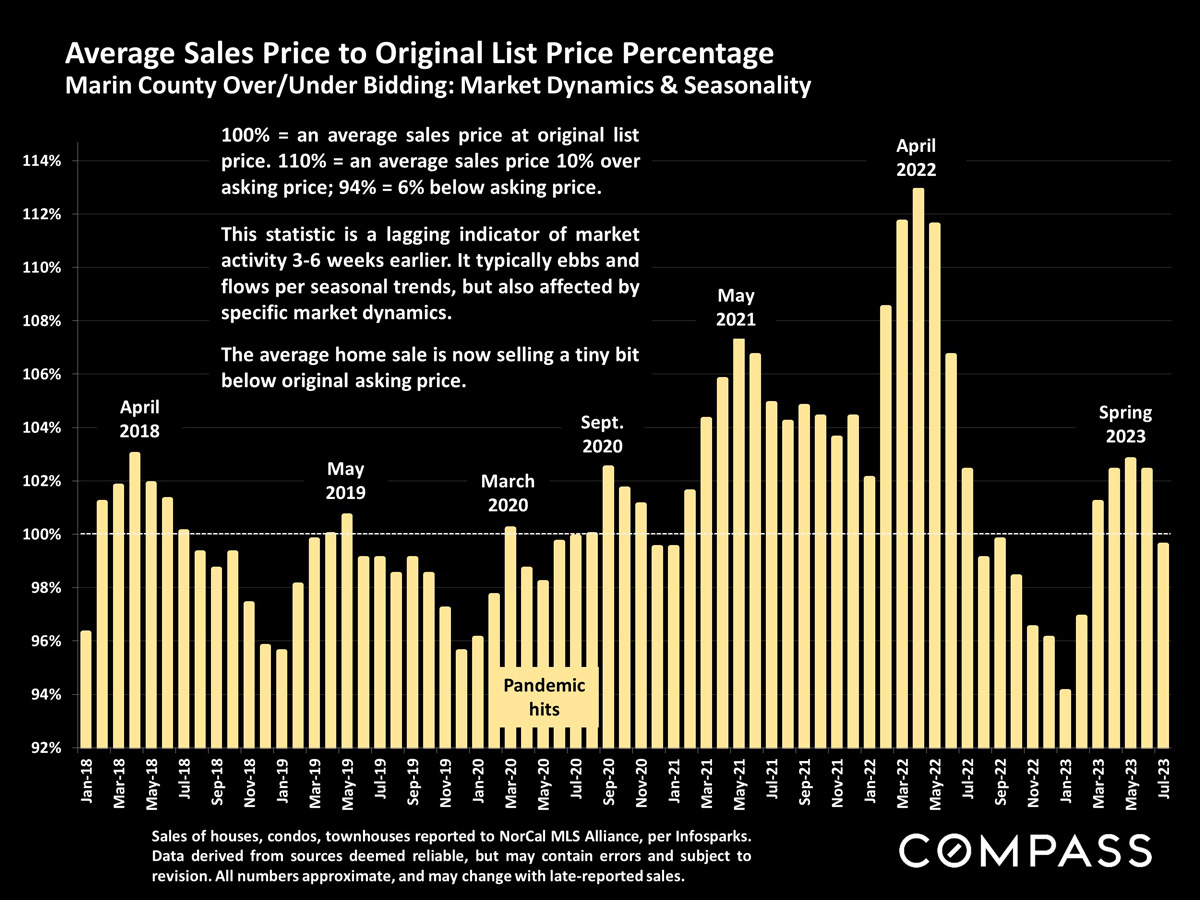
Across Bay Area counties, the year-over-year (y-o-y), 3-month-rolling, median home sales price declines that commonly peaked in spring have dropped quickly. Marin's y-o-y price decline plunged from 14% in April to 7% in July. Based on current trends, it will likely continue to dwindle and disappear in the second half of the year.
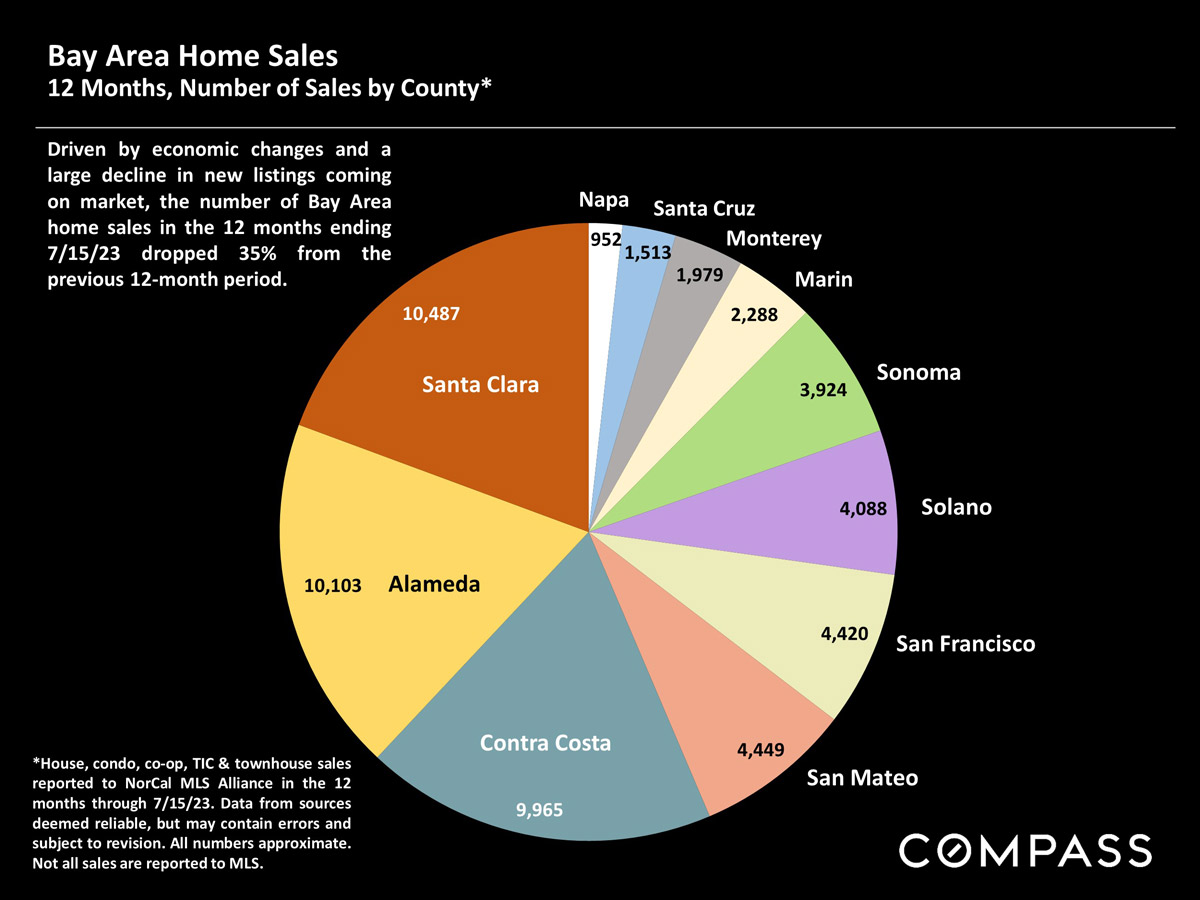
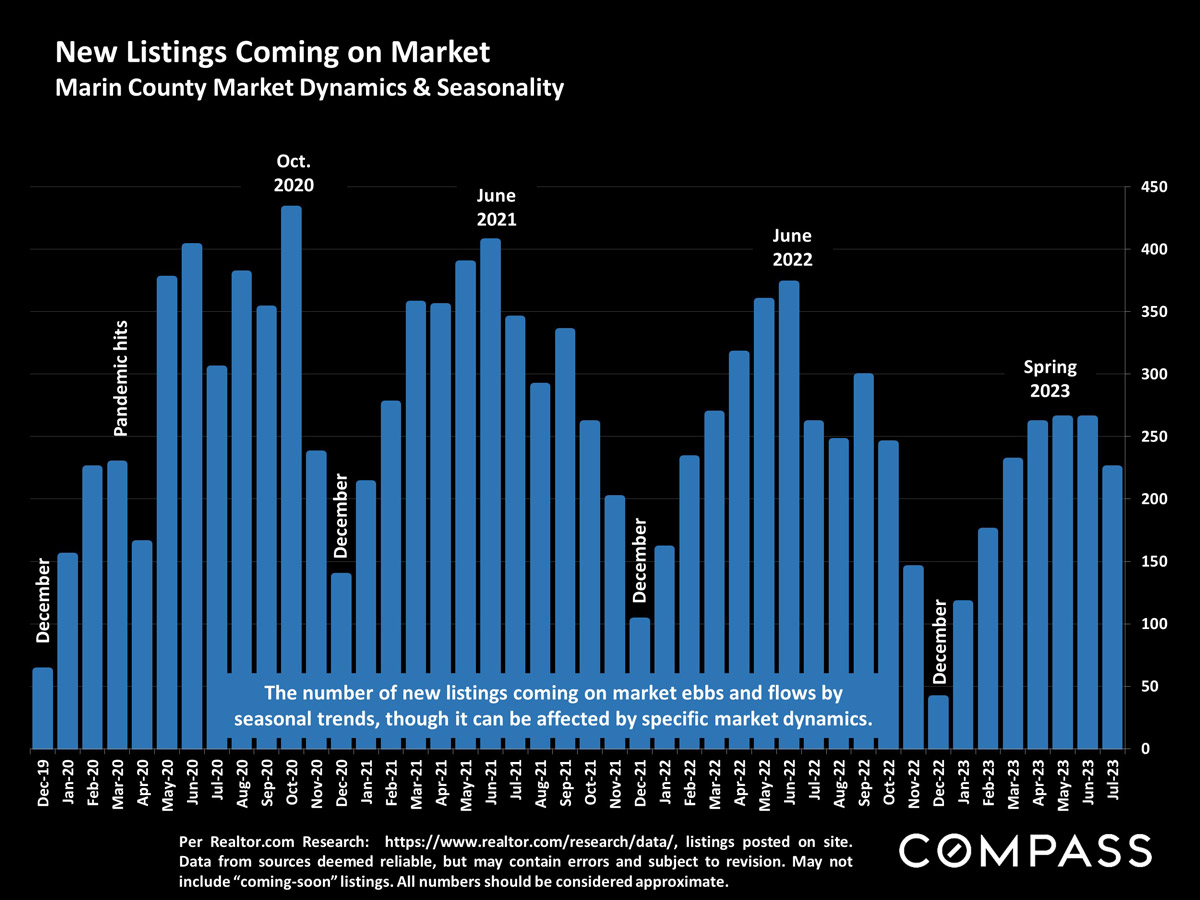
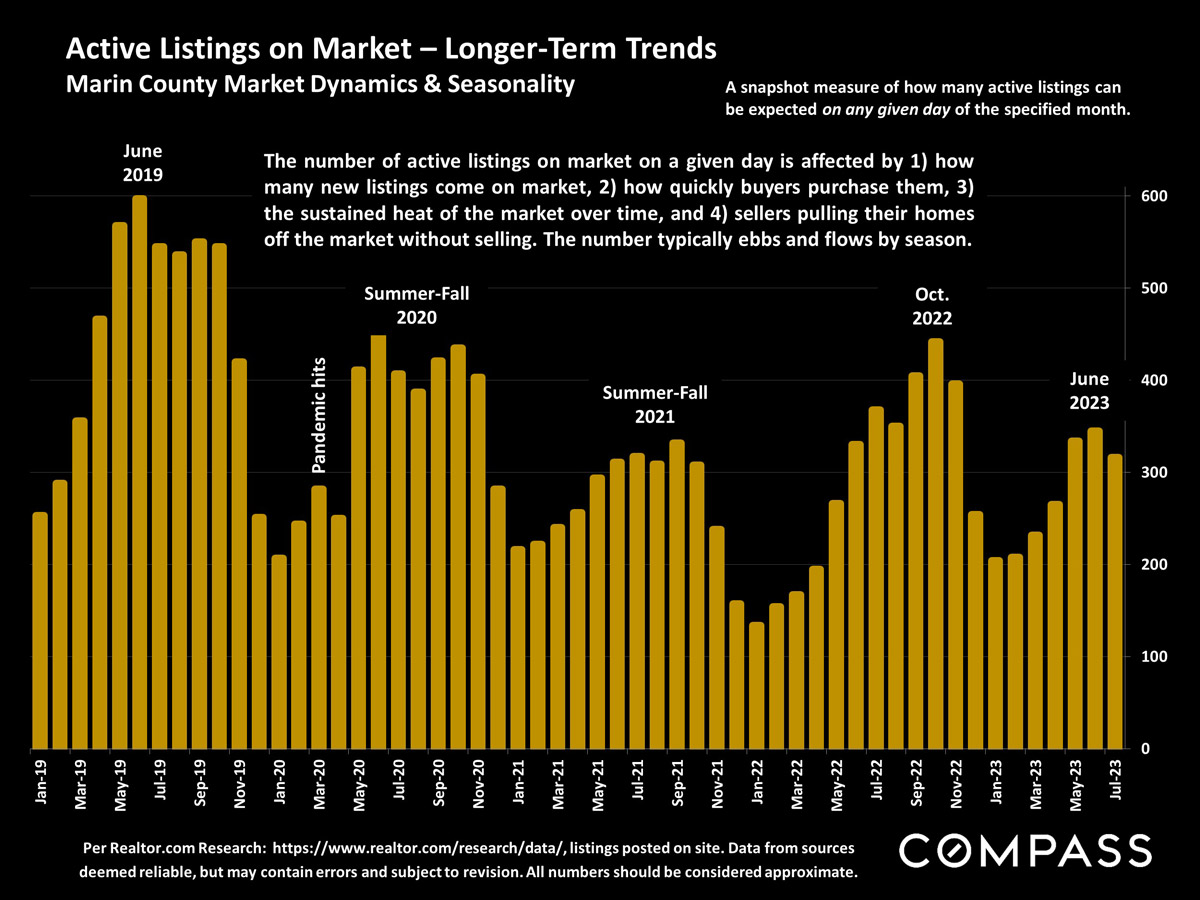
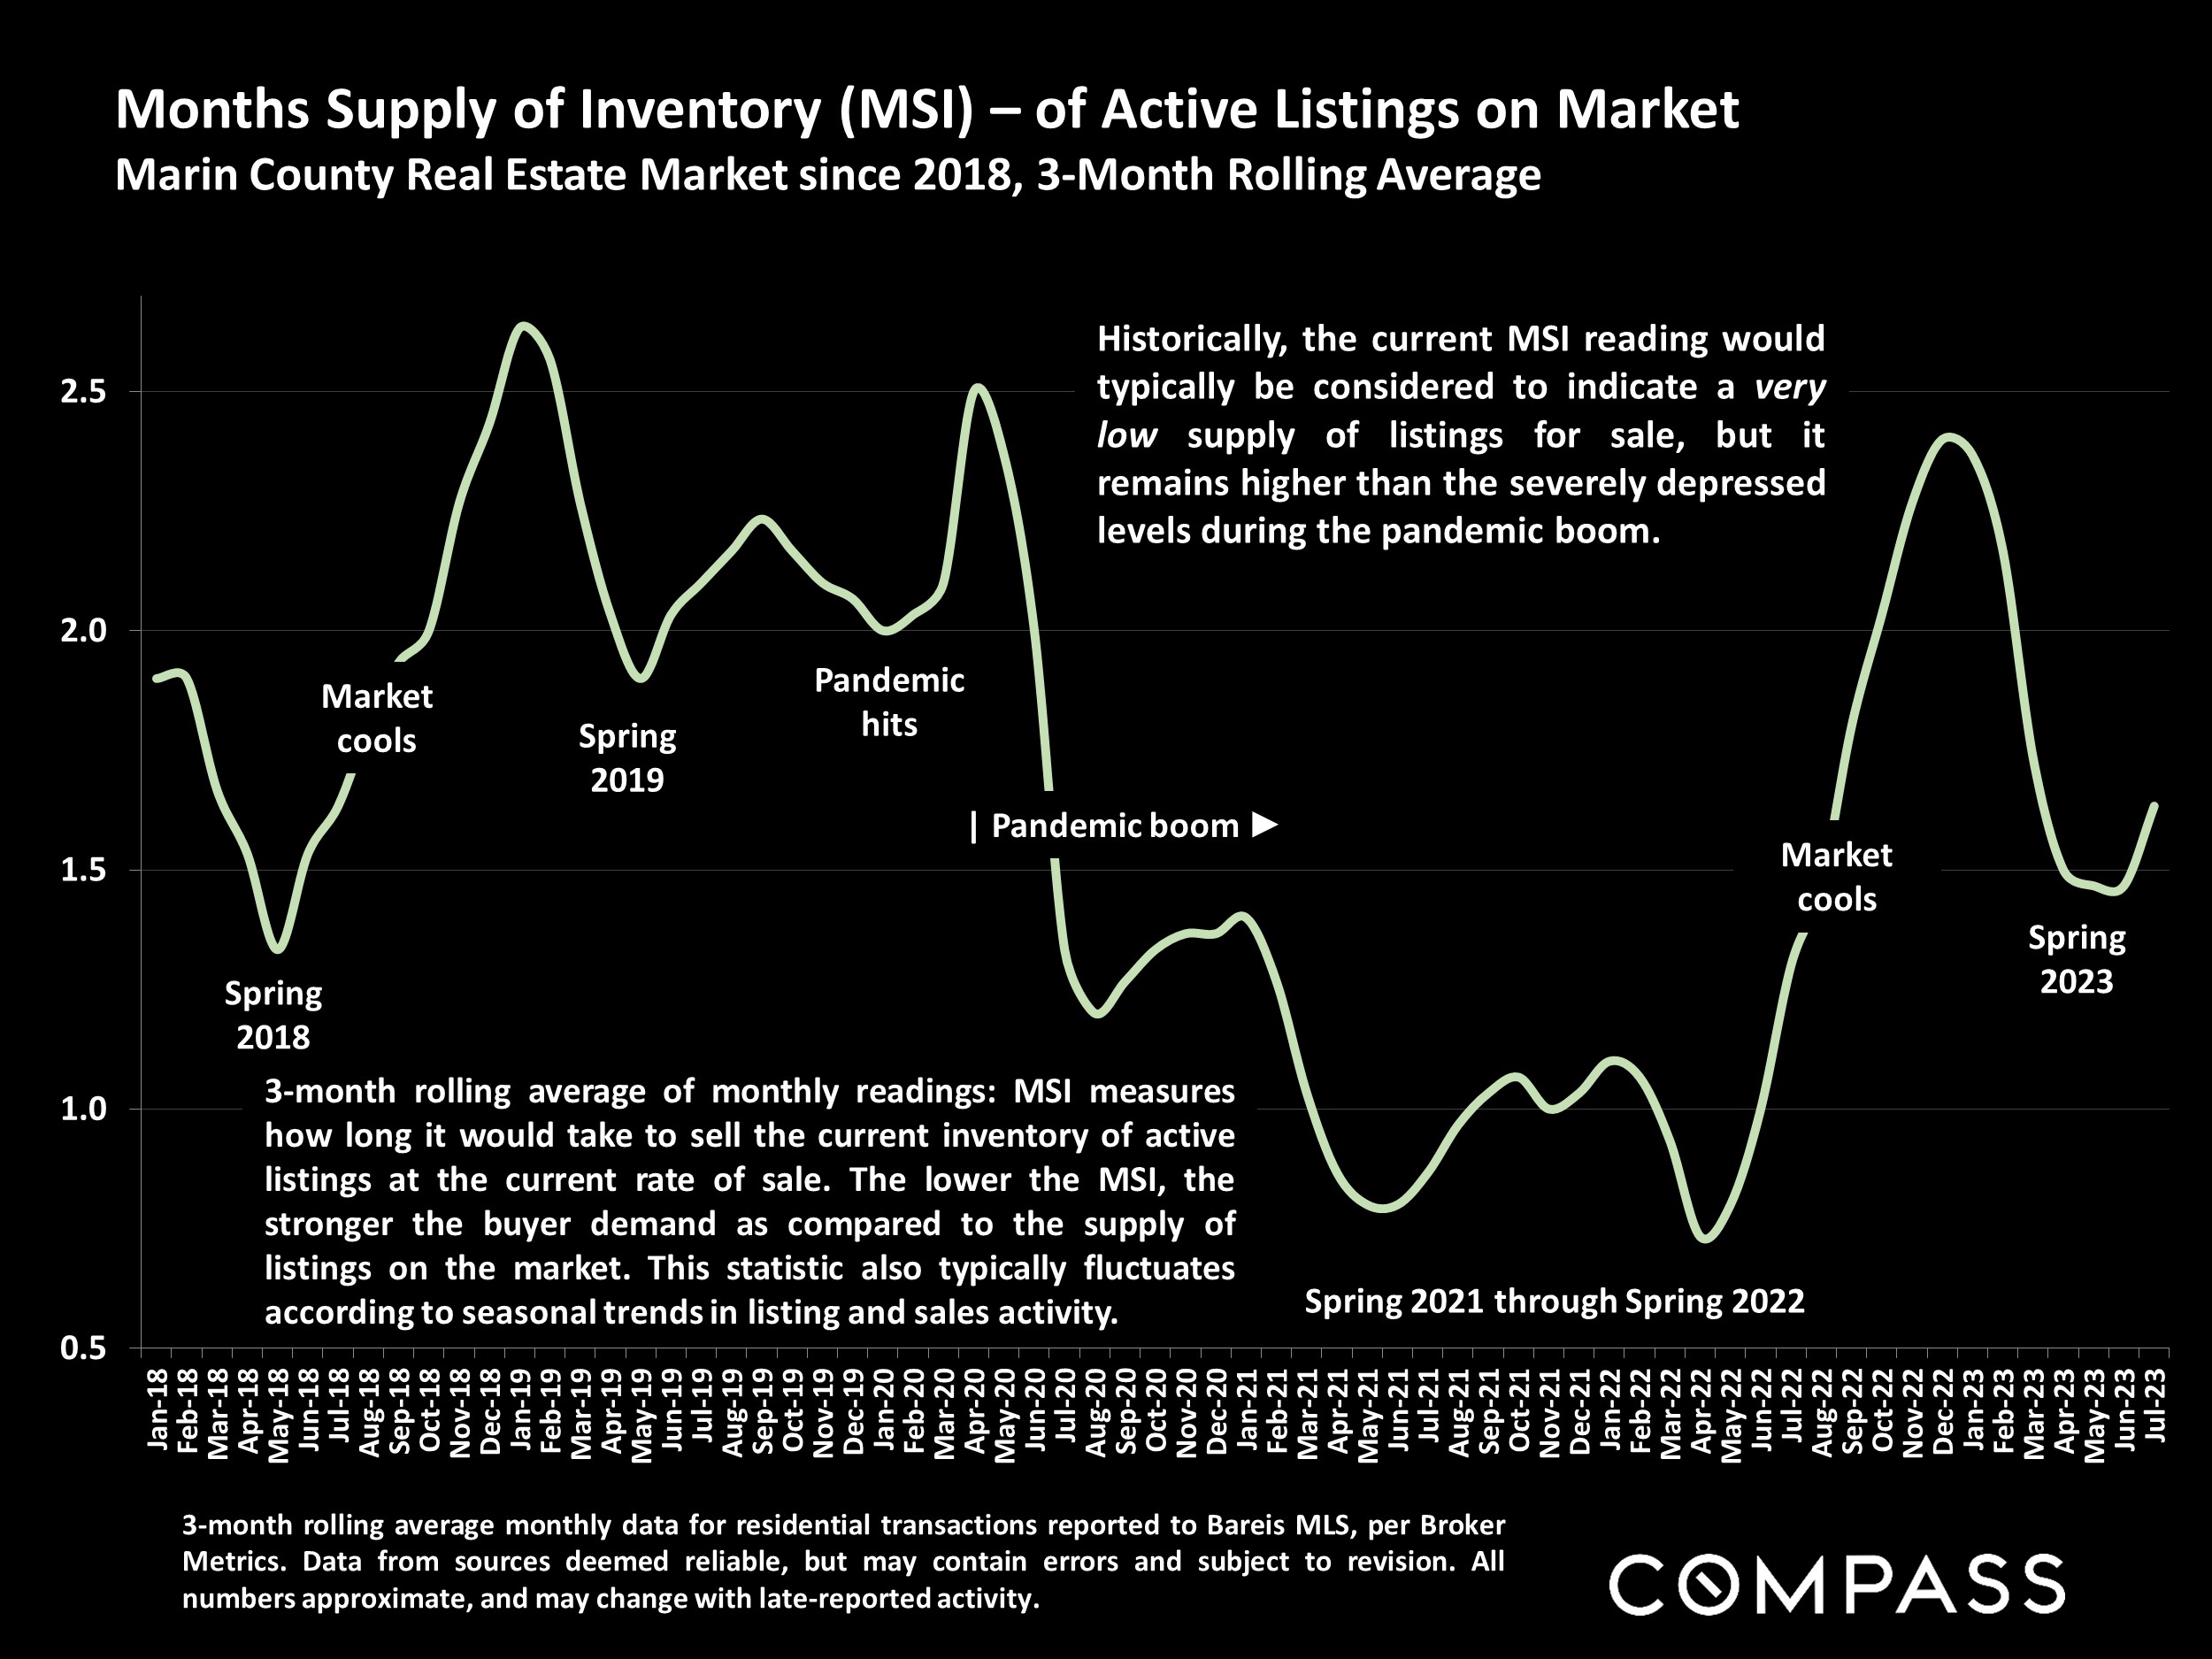
Low inventory remains a huge factor. The number of homes coming on the market in the seven counties of the San Francisco & San Jose Metro Areas during the past 12 months dropped 32% from the previous 12-month period: 22,000 fewer properties were put up for sale.* Along with the recovery in buyer demand, this has been a defining factor in 2023’s rebound in home prices.
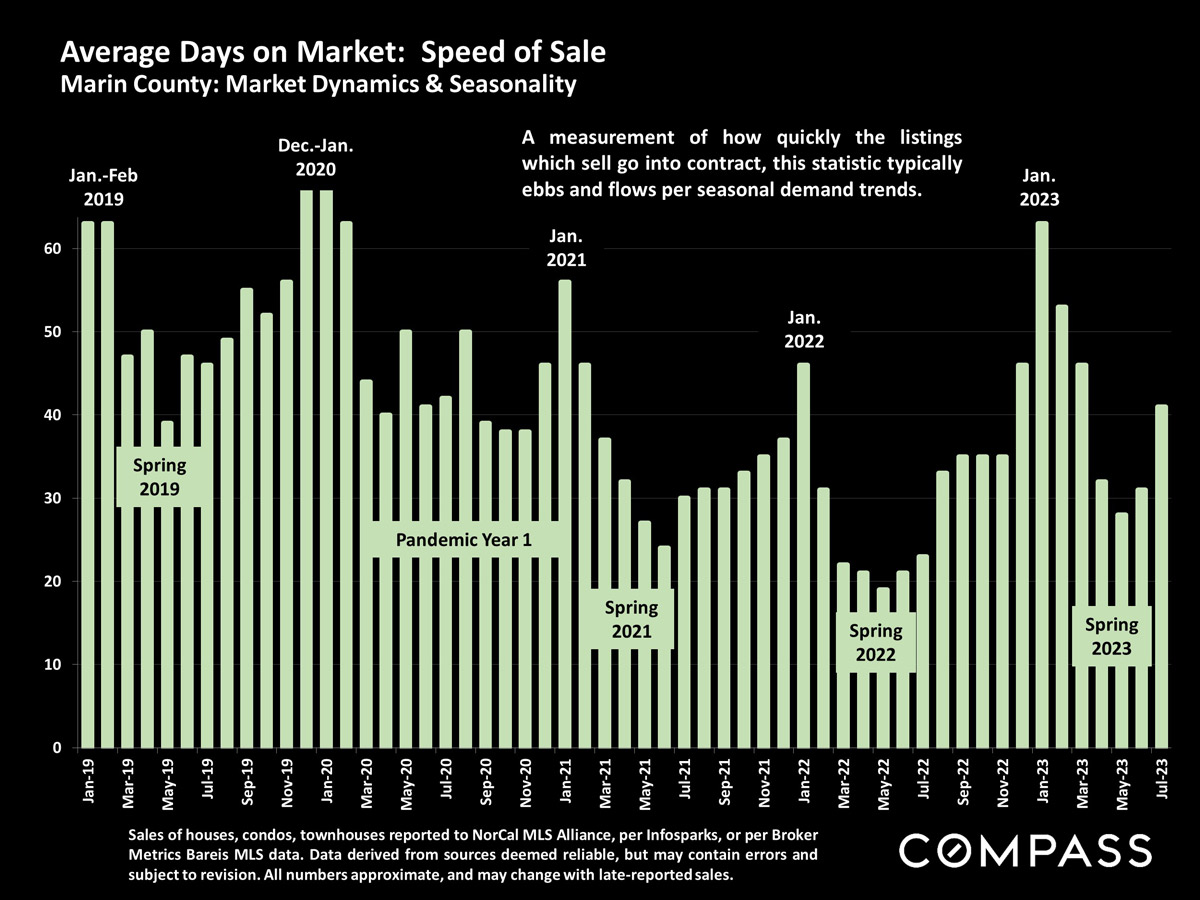
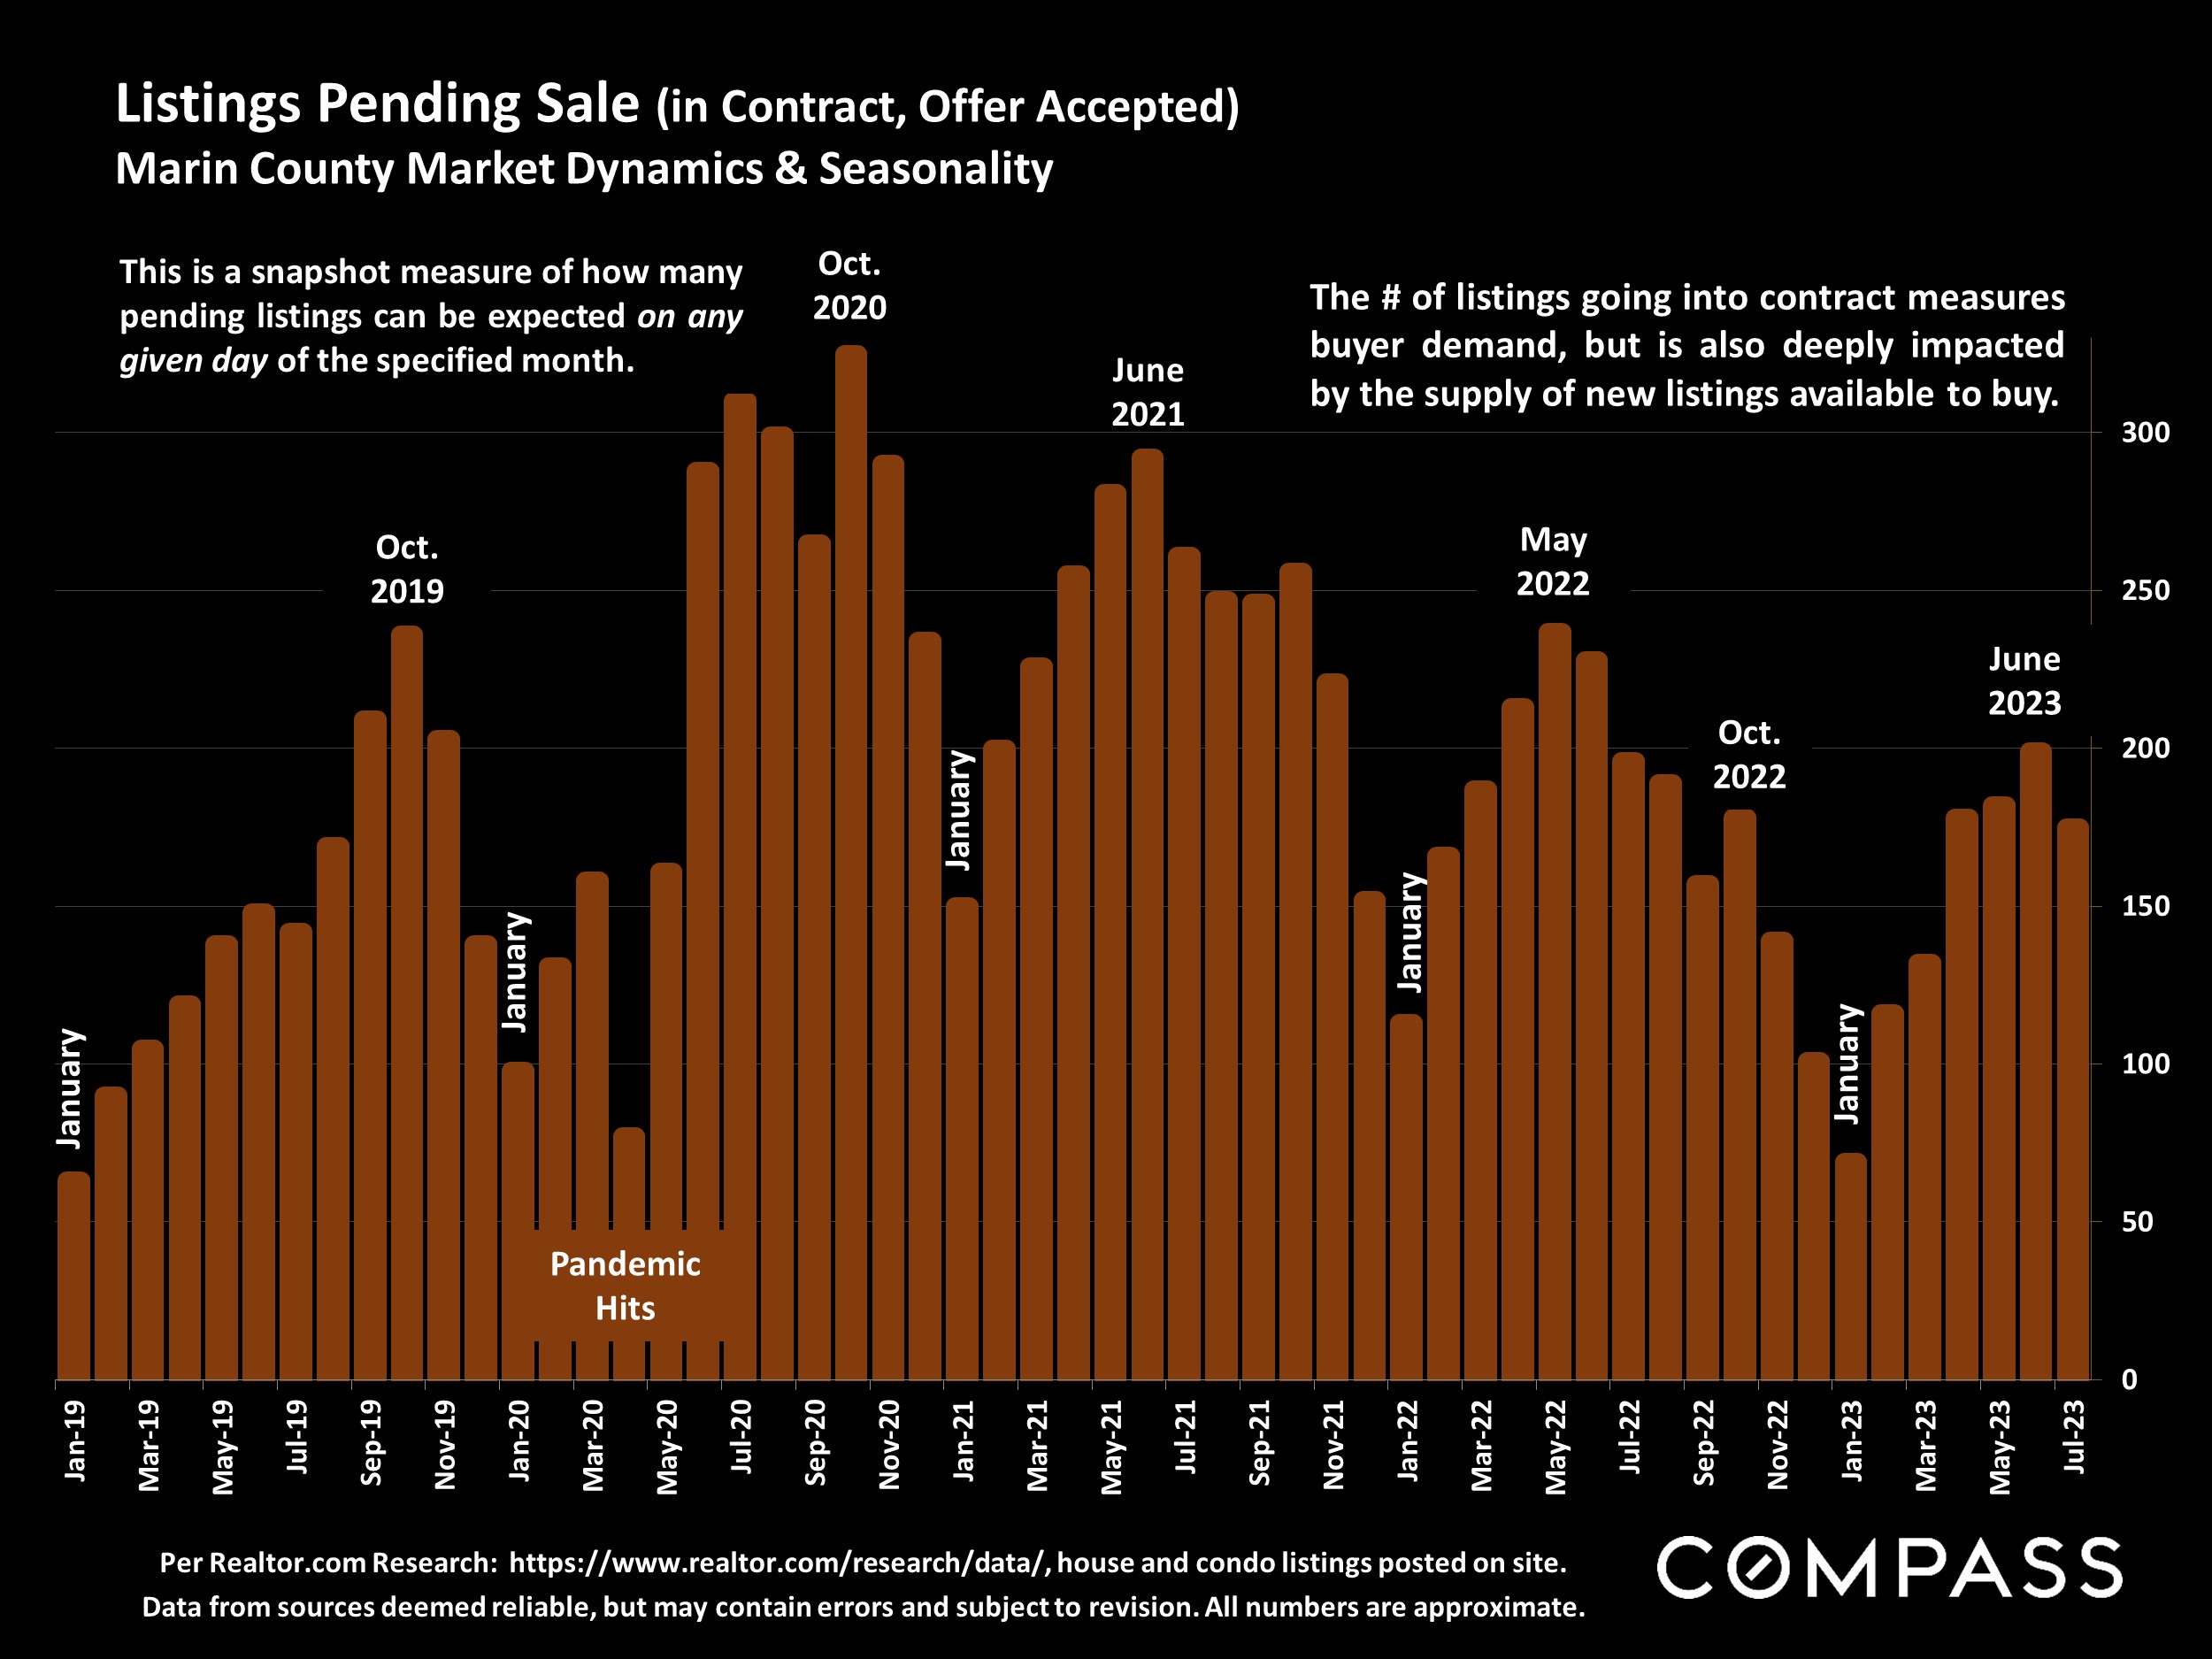
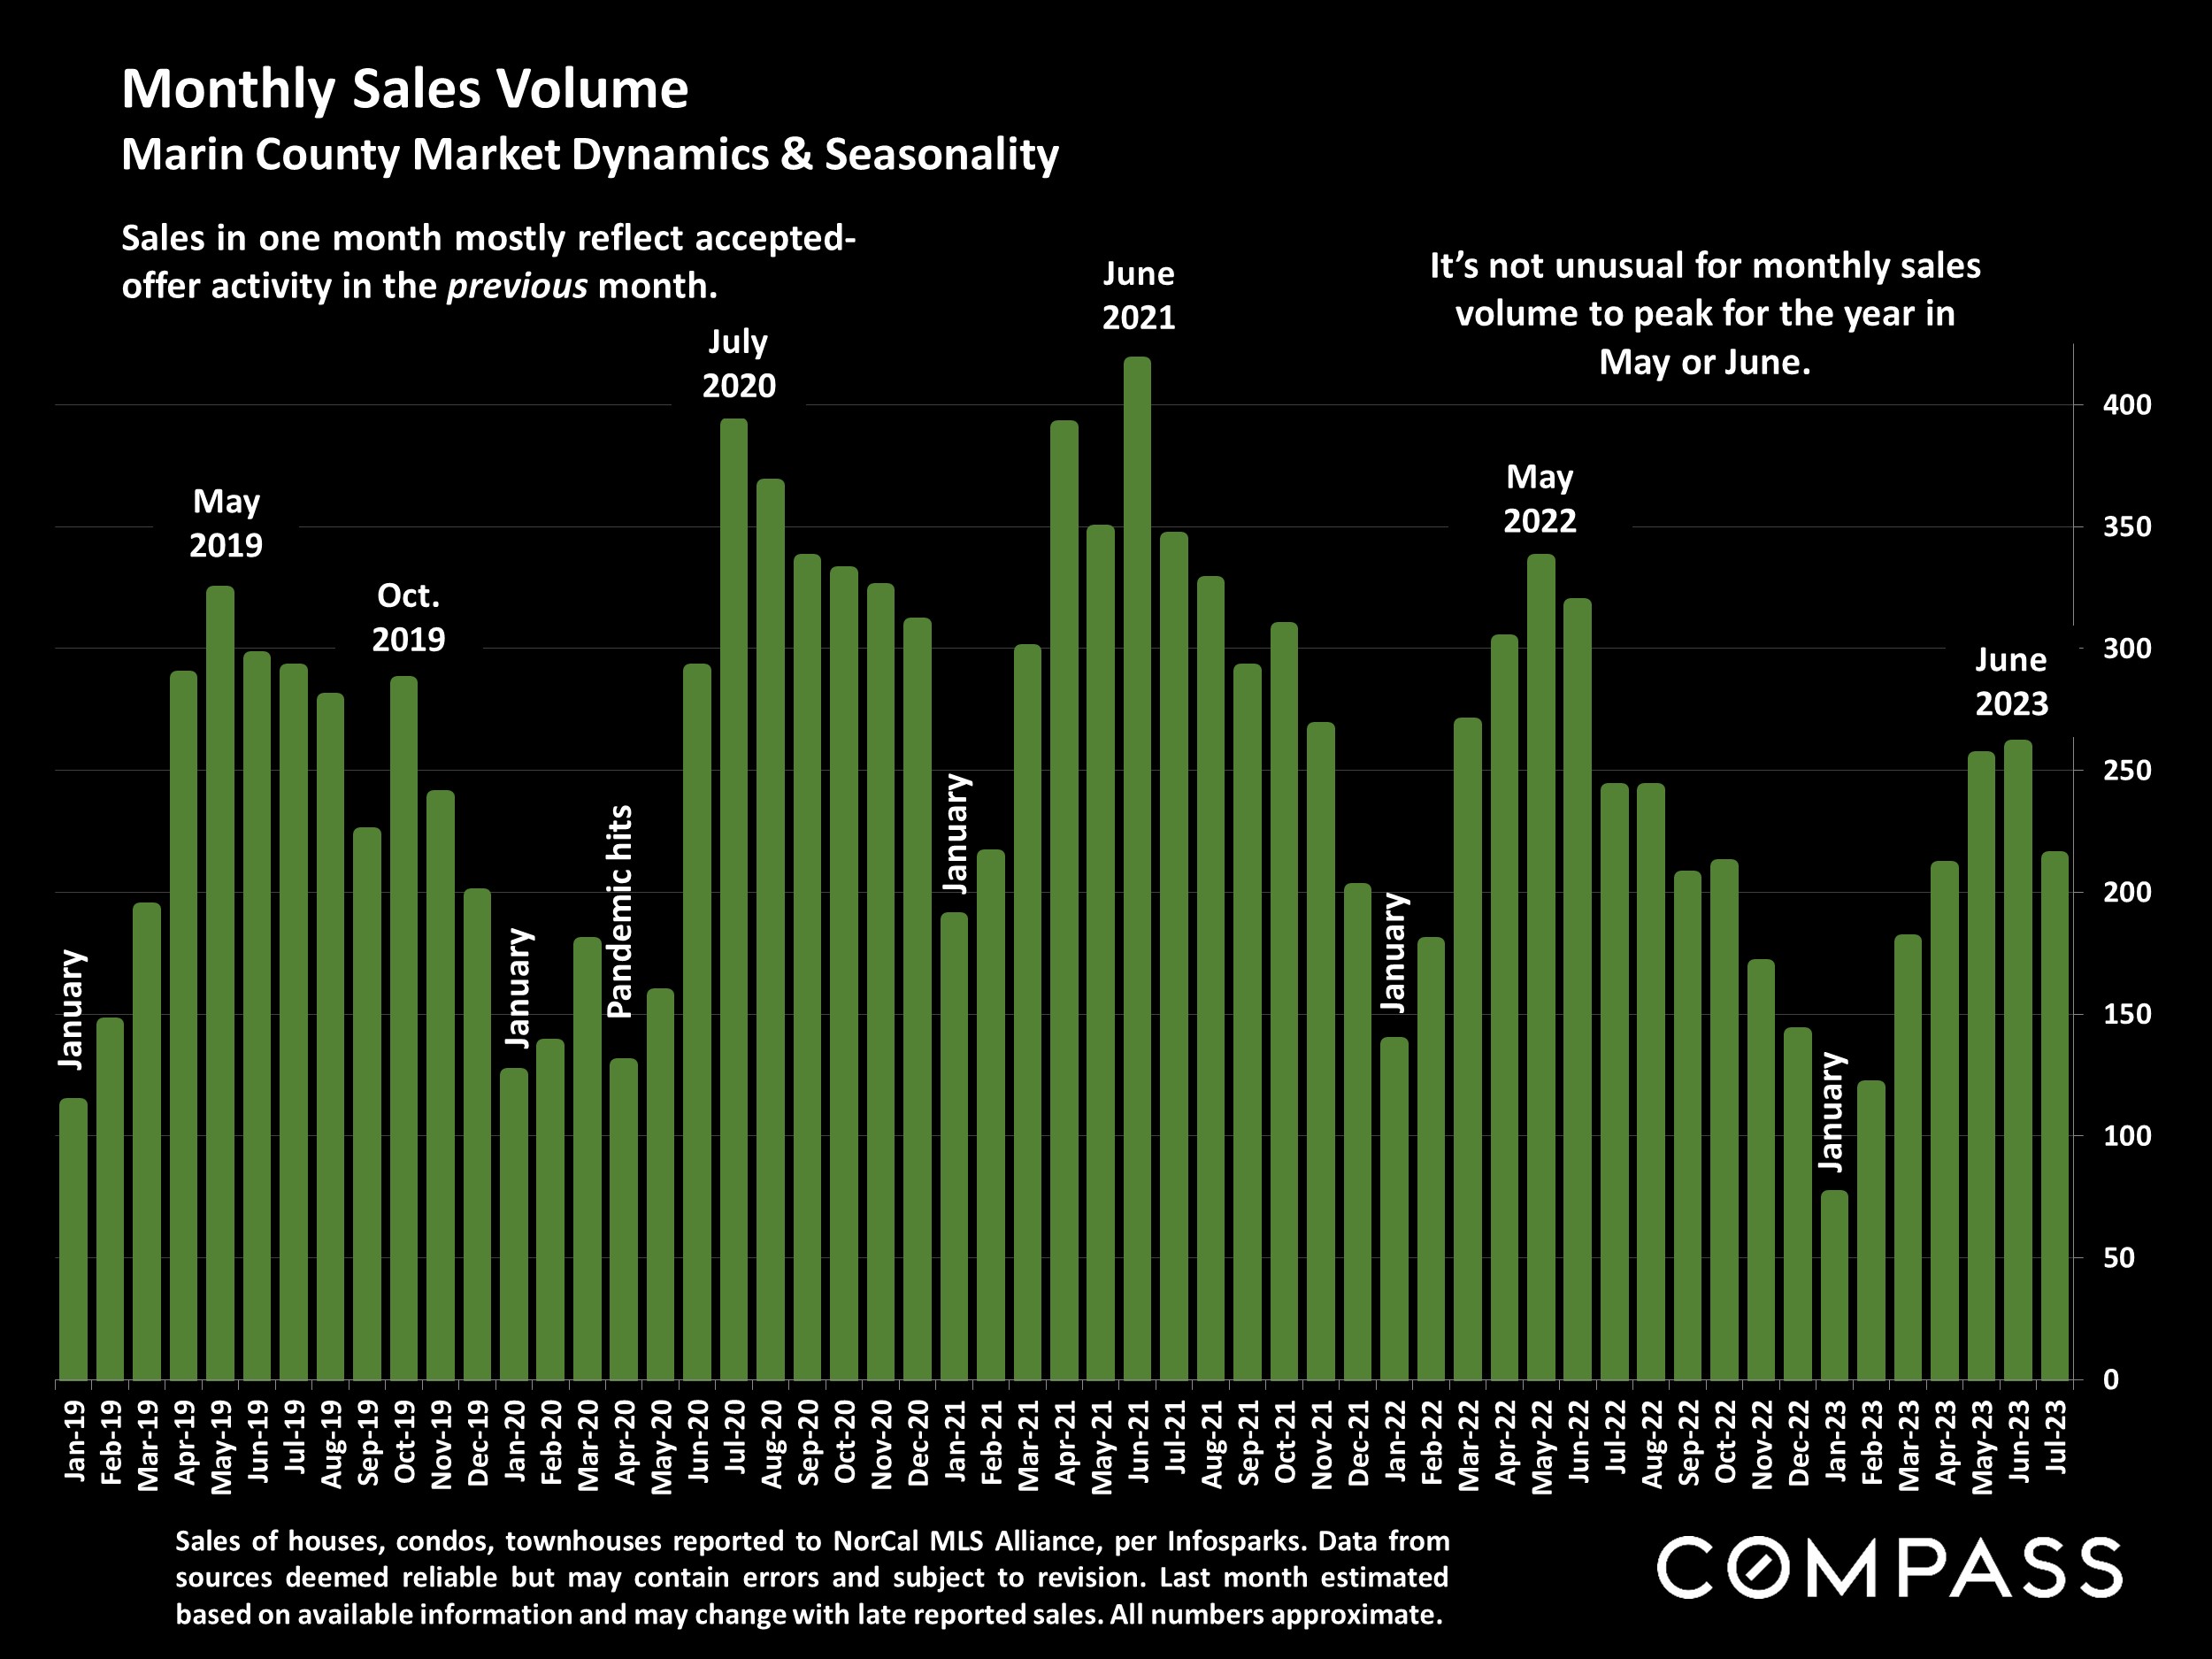
It is not unusual to see an autumn spike up in listing and sales activity after Labor Day, lasting through late October or early November, before the market subsides for the big, mid-winter holiday slowdown, which typically lasts until early in the new year.
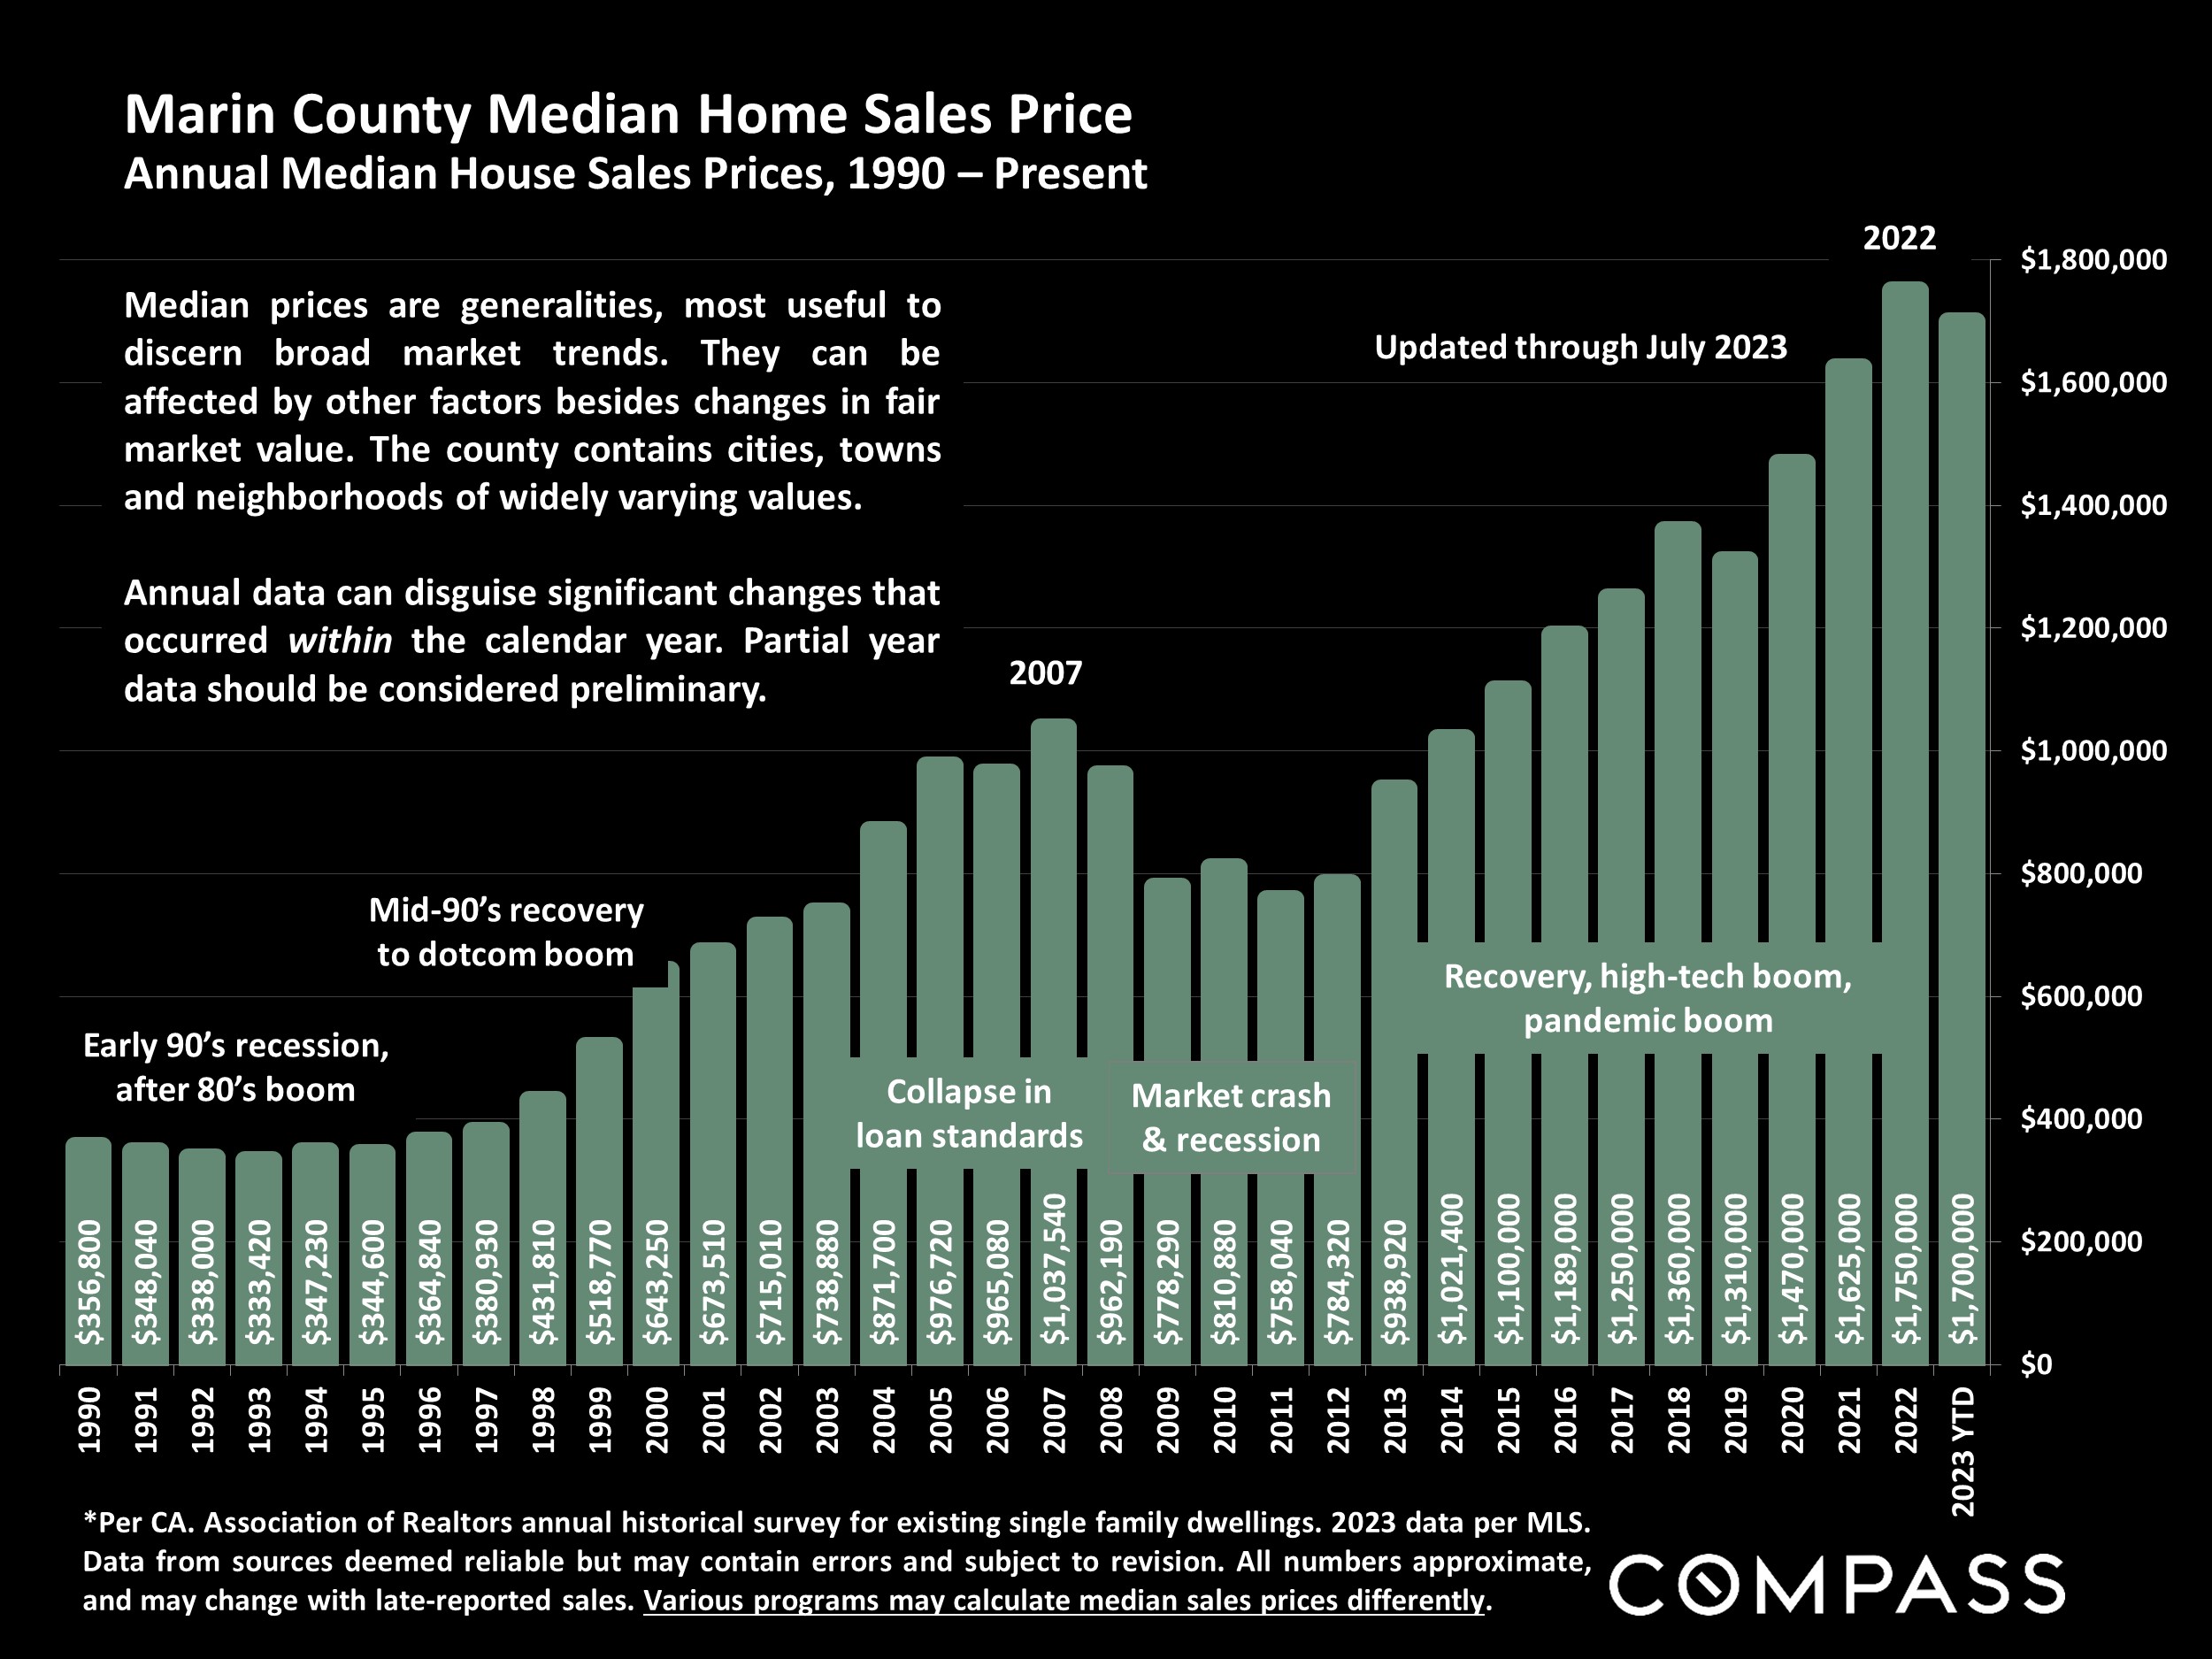
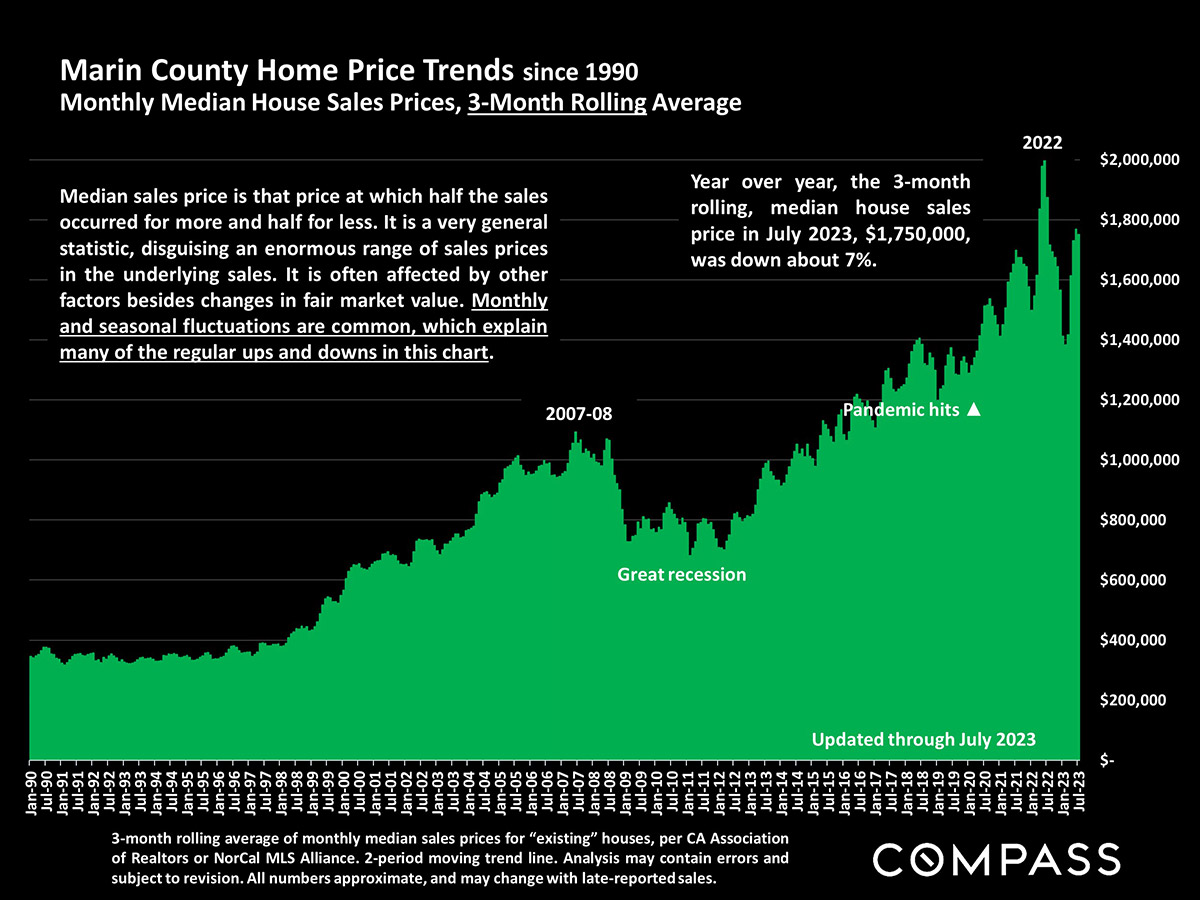
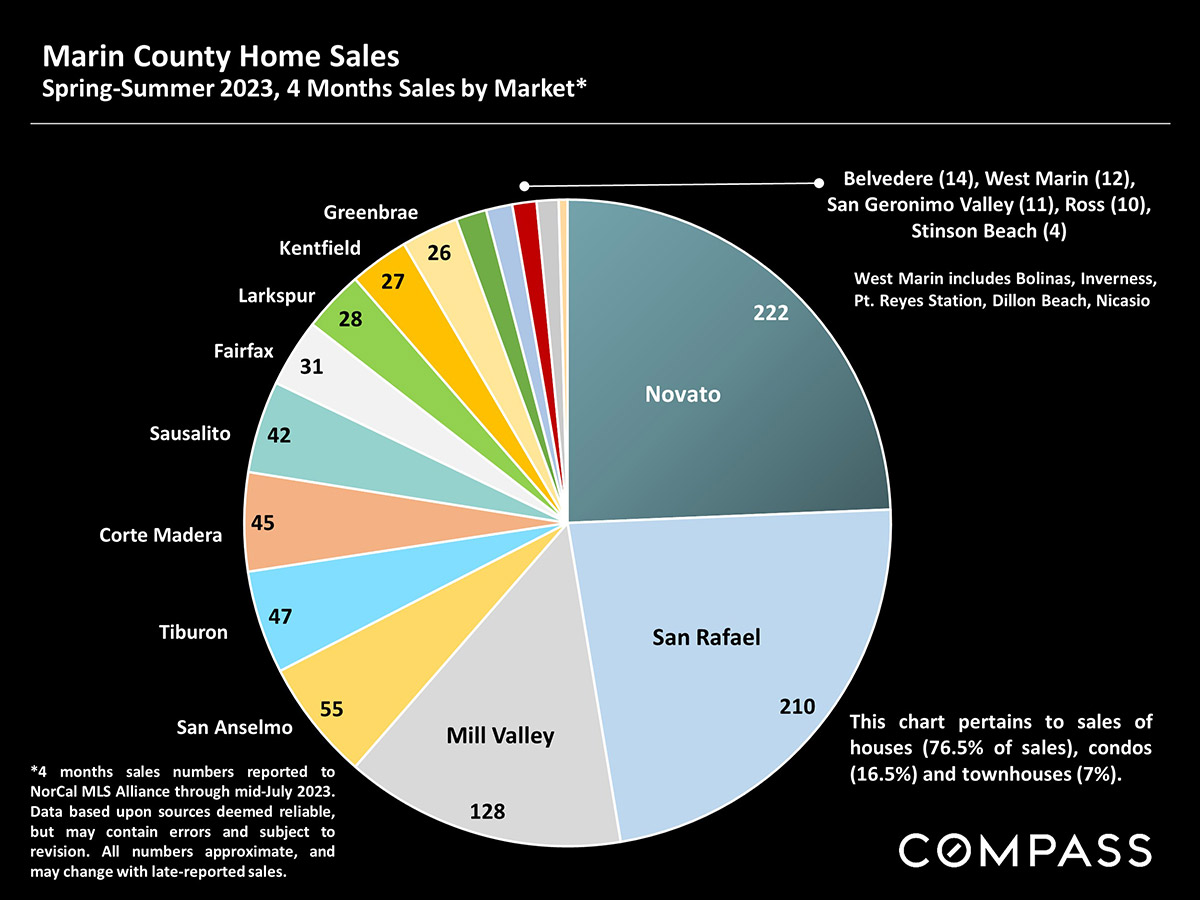
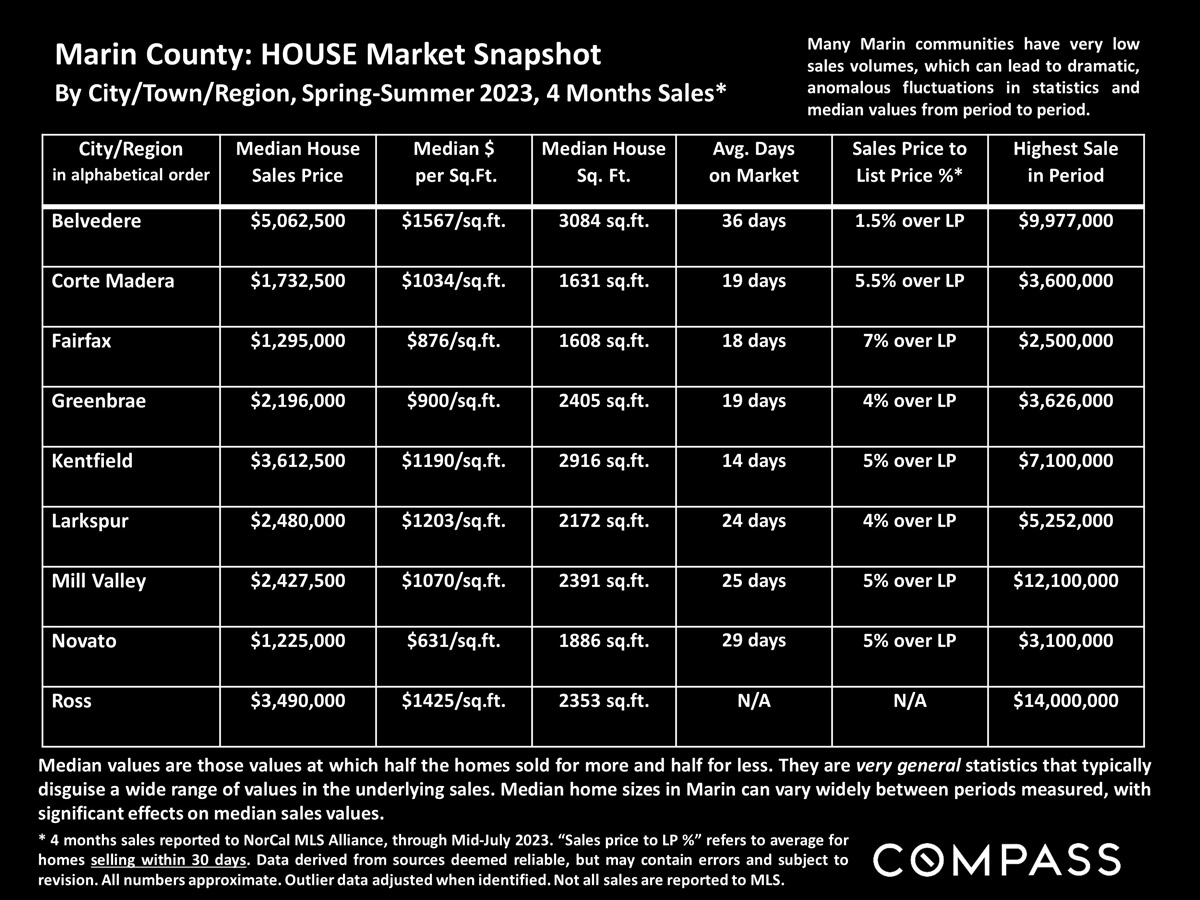
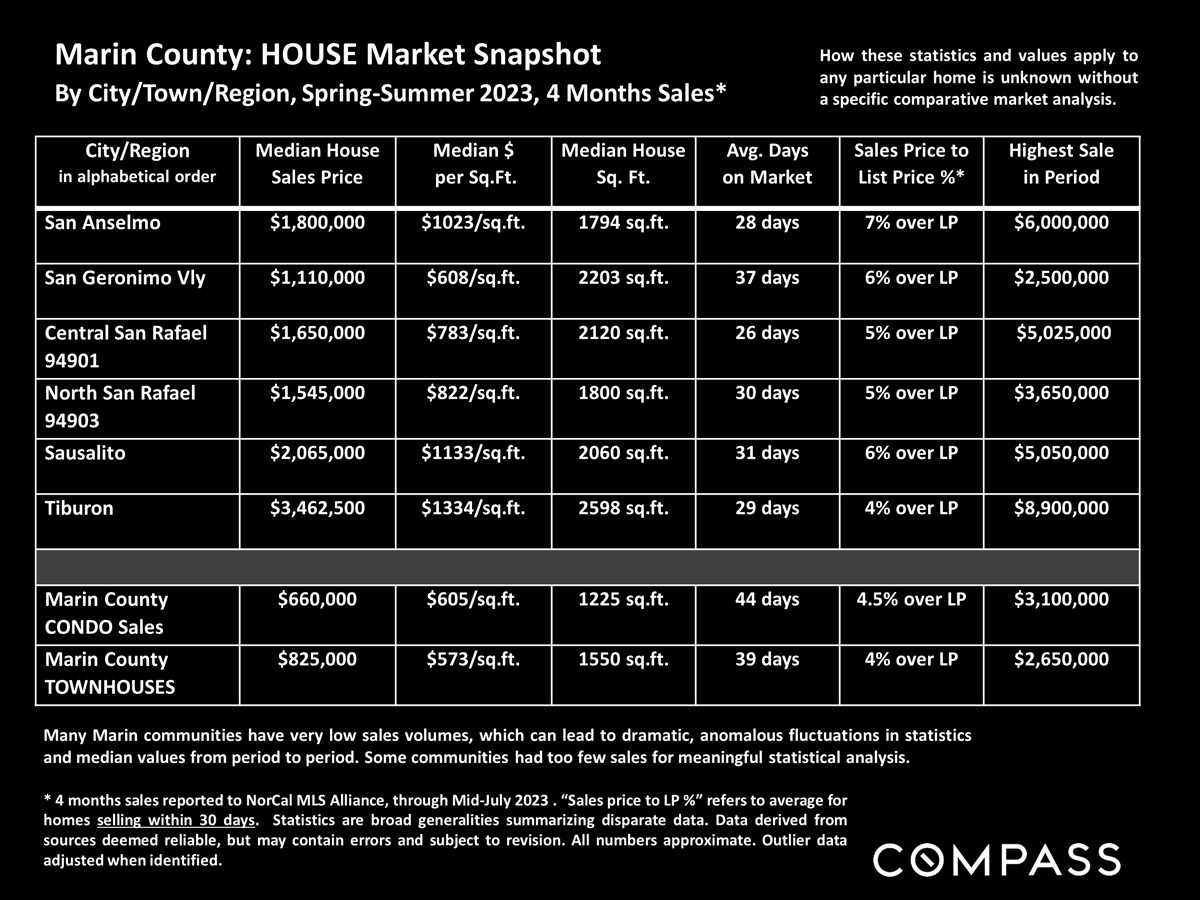
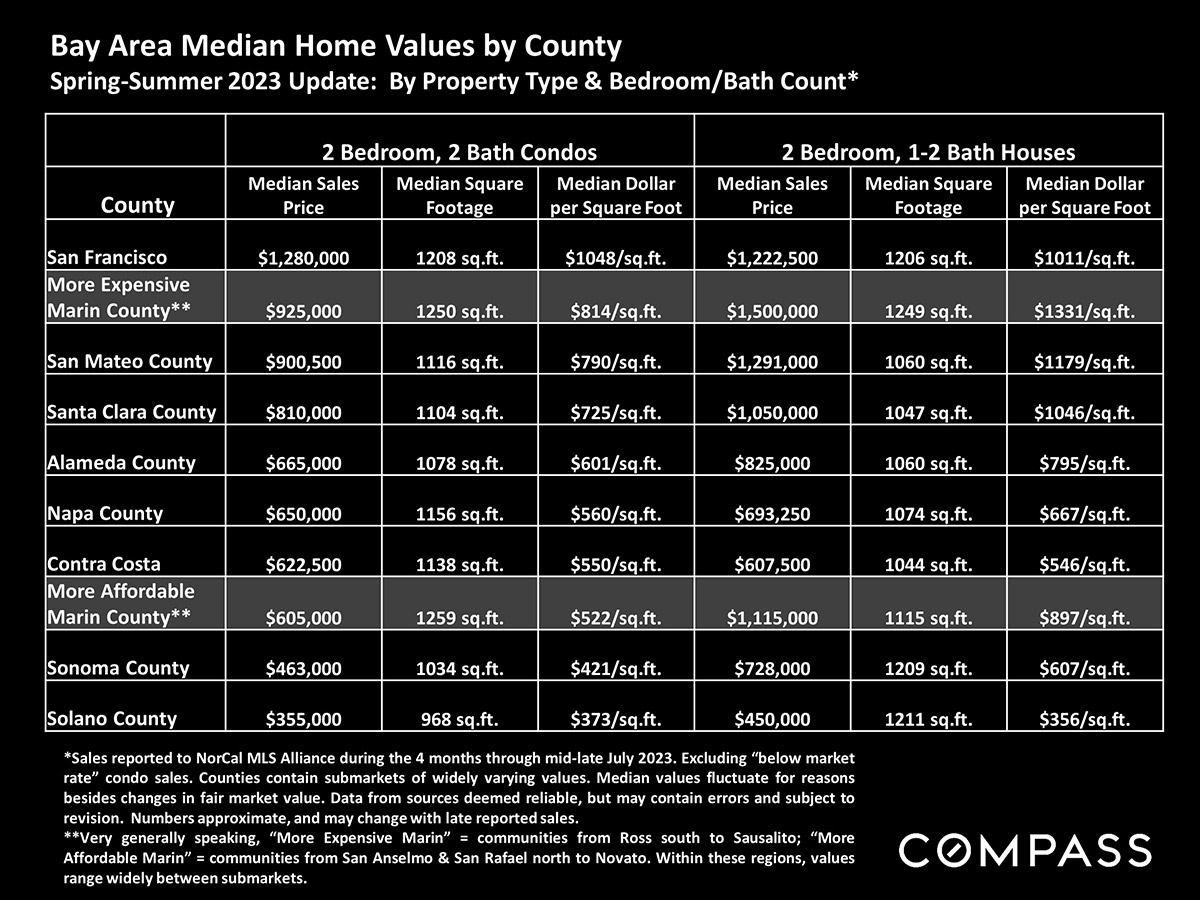
The first two charts review the first annual home prices for a broad review of appreciation trends and then 3-month-rolling prices for insight into shorter-term changes. This report also includes a review of home prices and market dynamics of submarkets within the county.
The autumn is a great time to buy or sell! Call me for exclusive insight.415-516-5084– Chris Glave |
Let's talk.
Whether you are looking to purchase Marin County real estate, are considering selling property, or would like advice on pre-sale updates and project management help, let's have a conversation and create a plan to help you achieve your real estate goals!
Contact